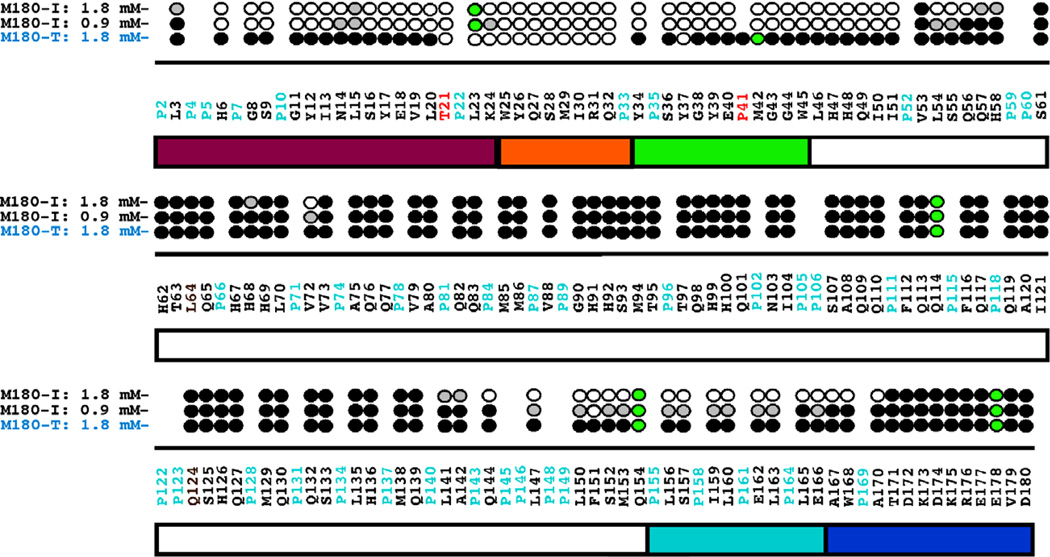
Fig. 3.
Summary of the amide resonances that partially disappear (grey-filled circles) or completely disappear (open circles) in the 1H-15N HSQC spectra of 15N-labelled M180-I and M180-T as a function of increasing protein concentration. Amide cross peaks whose intensity change little over the concentration range are indicated by solid circles and cross peaks that could not be tracked unambiguously are indicated by green-filled circles. The full murine amelogenin sequence is shown with the proline residues highlighted in cyan and the site of the point mutations highlighted in red.

