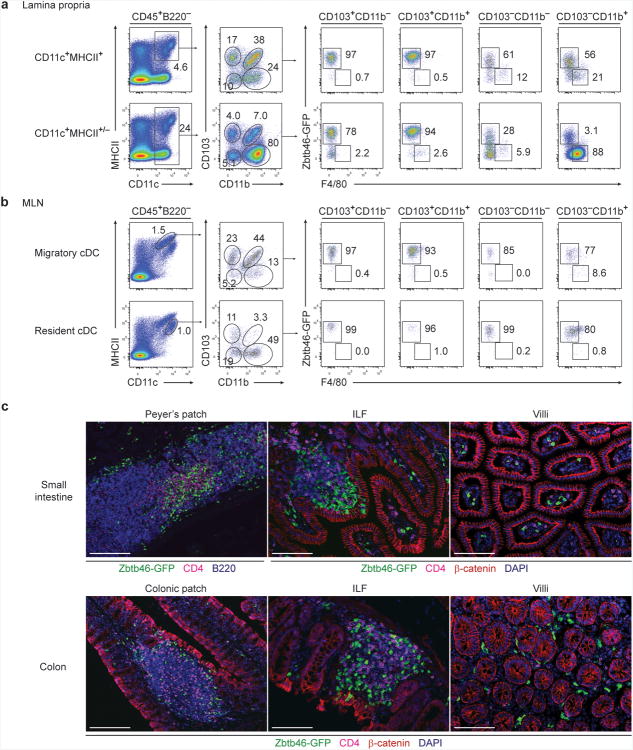
Figure 1. Zbtb46-GFP identifies intestinal cDC populations.
(a,b) Lamina propria (a) and MLN (b) cells from Zbtb46gfp/+ mice were stained for expression of the indicated markers. Two-color histograms are shown for live cells pre-gated as indicated above the diagram. Numbers represent the percentage of cells within the indicated gate. Data are representative of three independent experiments (n = 9 mice). (c) Small intestine (top) and colon (bottom) sections from Zbtb46gfp/+ → wild-type (WT) BM chimeras were analyzed by fluorescence microscopy for expression of B220, CD4, β-catenin, Zbtb46-GFP and DAPI as indicated. Images are representative of two independent experiments (n = 5 mice). Scale bars, 200 μm (Peyer's patch and colonic patch), 100 μm (ILFs and villi). ILF, isolated lymphoid follicle.

