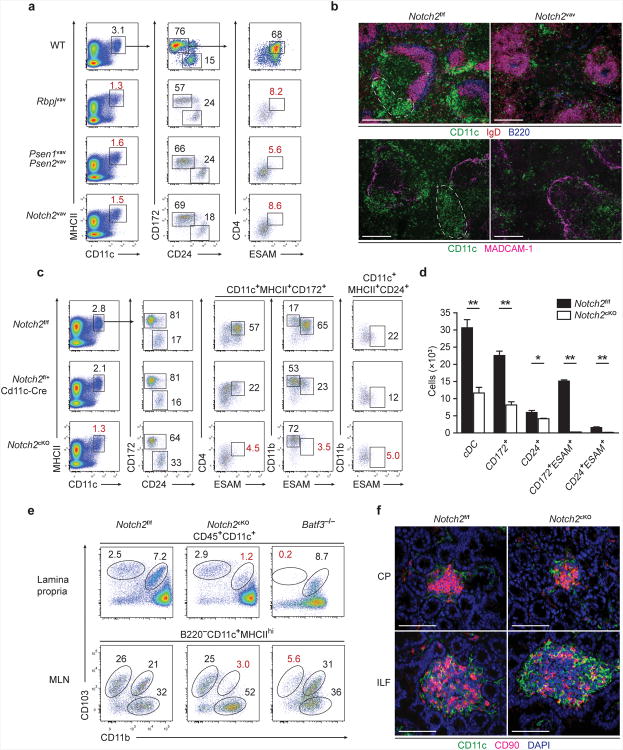
Figure 3. Canonical Notch2 signaling is required for splenic and intestinal CD11b+cDC development.
(a) Splenocytes were stained for the indicated markers. Two-color histograms are shown for live cells pre-gated as indicated. Data are representative of three independent experiments (n = 6-8 mice per group). (b) Spleen sections from Notch2f/f and Notch2vav mice were analyzed by fluorescence microscopy for expression of CD11c, IgD and B220 (top) or CD11c and MadCAM-1 (bottom). Images are representative of two independent experiments (n = 4 mice). Scale bars, 200 μm. (c) Splenocytes were stained for the indicated markers. Data are representative of three independent experiments (n = 7 mice per group). (d) Quantification of cDC development in Notch2cKO mice from [c]. Bars represent cDCs per 1 × 10⁶ splenocytes. Data are from three independent experiments (error bars, SEM; n = 7 mice per group, Student's t-test). (e) Lamina propria cells were stained for the indicated markers. Data are representative of three independent experiments (n = 3-5 mice per group). (f) Immunofluorescence images of CPs and ILFs from small intestine sections stained for CD11c, CD90 and DAPI. Images are representative of two independent experiments (n = 5 mice). Scale bars, 50 μm. CP, cryptopatch. * P < 0.01, ** P < 0.001.

