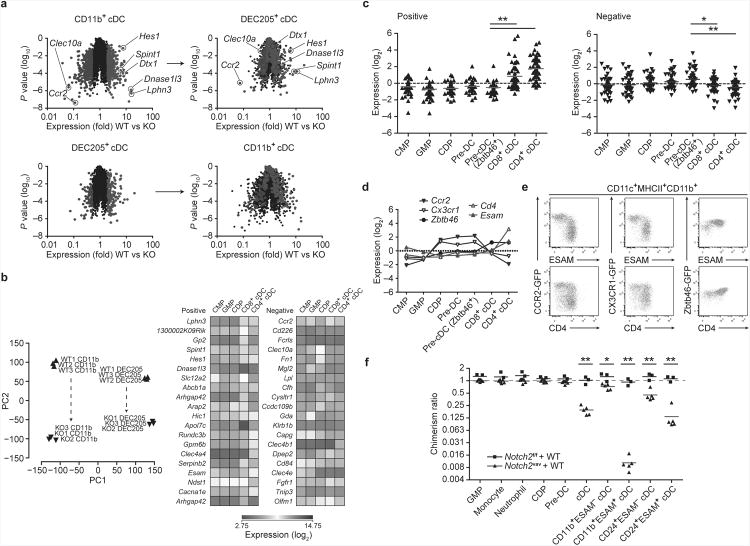
Figure 4. Notch2 controls terminal differentiation of CD11b+ and DEC205+cDCs.
(a) Shown is microarray analysis of sorted cDC subsets from Notch2f/f (WT) and Notch2cKO (KO) mice. CD11b+ DCs were sorted as MHCII+CD11c+CD24−CD11b+ cells. DEC205+ DCs were sorted as MHCII+CD11c+CD24+CD11b−DEC205+ cells. Colored points represent genes increased more than 2-fold (red) or decreased more than 2-fold (blue) in the indicated cDC subset (left) and then plotted in the complementary subset (right). Data are from two independent experiments (n = 3 biological replicates per cell type in both WT and KO mice, Welch's t-test). (b) Left: PCA of WT and KO CD11b+ cDCs and DEC205+ cDCs, analyzed by individual replicate. Proportion of variance: PC1 54.0%, PC2 21.0%. Right: Heat map showing log-transformed expression values from progenitors and cDC subsets derived from the ImmGen database for probesets corresponding to the 20 most positive and negative loadings in PC2. (c) Shown are mean-centered, log-transformed expression values from DC progenitors and subsets for probesets corresponding to the 50 most positive and negative loadings in PC2. Each symbol represents a unique gene (bars, mean; Kruskal-Wallis test, Dunn's multiple comparison test). (d) Expression of selected loadings from [c] were analyzed by gene expression derived from the ImmGen database (left) and by flow cytometry of splenic CD11b+ cDCs in Ccr2gfp,Cx3cr1gfp, and Zbtb46gfp mice (right). Flow cytometry data are representative of three independent experiments (n = 5-6 mice per group). (e) Mixed BM chimeras were generated from CD45.2+Notch2vav BM and CD45.1+ WT BM or from CD45.2+Notch2f/f and CD45.1+ WT BM. Bone marrow progenitors and splenocytes were analyzed for donor contribution 8-10 weeks following lethal irradiation and transplant. Shown is the contribution of Notch2vav BM or Notch2f/f BM to each cell-type as a ratio of LSK chimerism in the same animal (% CD45.2+ contribution in cell-type/% CD45.2+ in LSK). Monocyte, neutrophil and cDC chimerism was analyzed in splenocytes. Each symbol represents an individual mouse. Data are from two individual experiments (bars, mean; n = 3-5 mice per group, Student's t-test). * P < 0.01, ** P < 0.001.

