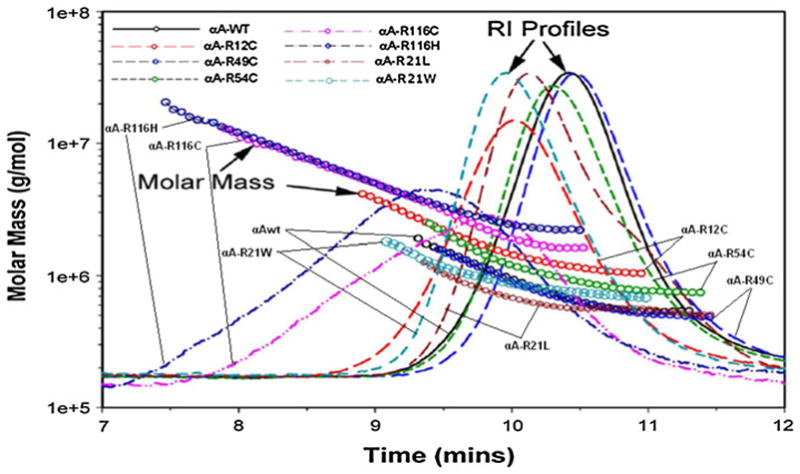
Fig. 3.

Overlay of molecular mass versus elution time of human αA-wt and its mutants as determined by DLS measurements. The chromatogram of each protein was recorded as RI. The molar mass values were computed with ASTRA (5.1.5) software from Wyatt Technology (see Table 1 for the values)
