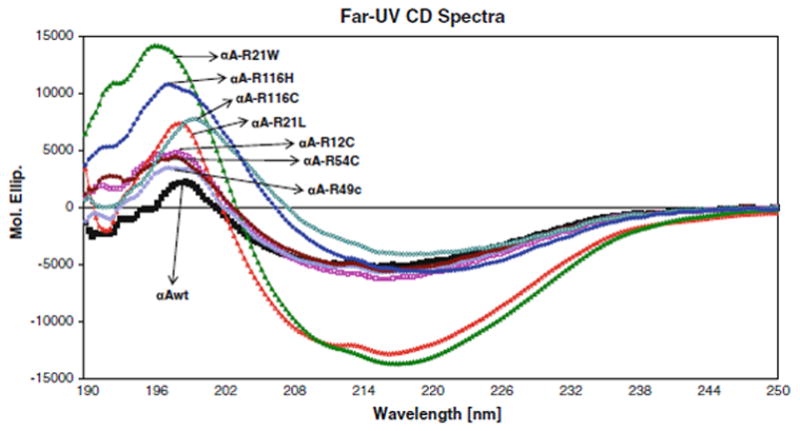
Fig. 4.

Far-UV spectra of Far-UV CD Spectra αA-wt and its mutants. Protein concentration was 0.1 mg/ml, and the quartz cell path length was 1.0 mm. The reported CD spectra were the average of smoothed five scans

Far-UV spectra of Far-UV CD Spectra αA-wt and its mutants. Protein concentration was 0.1 mg/ml, and the quartz cell path length was 1.0 mm. The reported CD spectra were the average of smoothed five scans