Fig. 3.
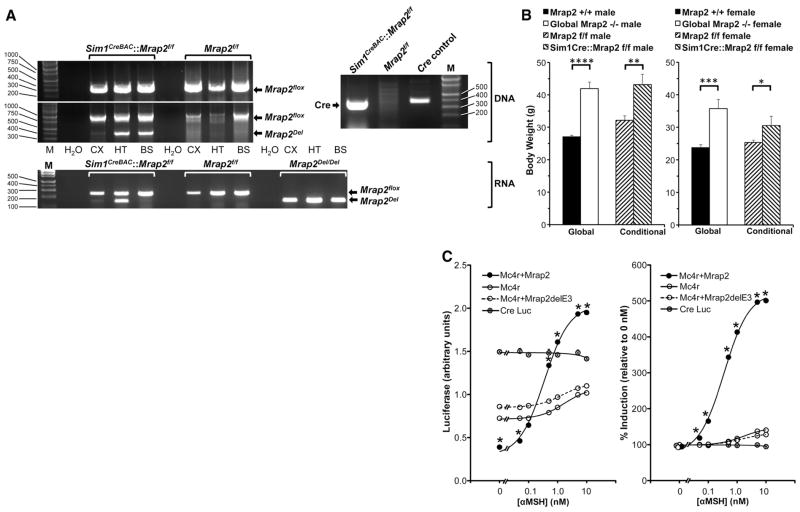
Interaction between Mrap2 and Mc4r. (A) Conditional deletion of Mrap2 in Sim1neurons. Top right, Cre DNA analysis by PCR. HT DNA from Sim1CreBAC::Mrap2f/f mice contains Cre (374 bp), but from Mrap2f/f mice does not. Molecular weight marker (M) on right (bp). Top left, Mrap2 DNA analysis in Sim1CreBAC::Mrap2f/f and Mrap2f/f mice by PCR. Both genotypes contain floxed, intact Mrap2 DNA in CX, HT, and BS (314 bp in upper electropherogram, and 1013 bp in lower electropherogram, molecular weight markers on left). Only Sim1CreBAC::Mrap2f/f mice contain Mrap2Del (400 bp, lower electropherogram), and only in HT and BS, but not in CX, consistent with fluorescent reporter data (Fig. S3A). No PCR products are present without added DNA (H2O). Bottom, Mrap2 mRNA expression in Sim1CreBAC::Mrap2f/f and Mrap2f/f mice by RT-PCR. Both genotypes express floxed, intact Mrap2 mRNA in CX, HT, and BS (247 bp). Only Sim1CreBAC::Mrap2f/f mice express Mrap2Del mRNA (147 bp), and only in HT. Global Mrap2Del/Del mice express Mrap2Del mRNA in all 3 sites. (B) Body weights of Mrap2+/+ (male n=6, female n=11), Mrap2−/− (male n=11, female n=7), Mrap2f/f (male n=8, female n=12) and conditional Sim1CreBAC::Mrap2f/f (male n=8, female n=7) mice, all age 133 days. *p=.04, **p=.007, ***p=.0002, ****p<.0001. (C) Effect of Mrap2 on Mc4r signaling. Left panel: Level of cAMP reporter activity (CRELuc) in CHO cells alone, or co-transfected with Mc4r, with or without Mrap2 or the Mrap2 knockout construct, Mrap2delE3, 5 h following exposure to 0–10 nM αMSH (n=3/group). Right panel: cAMP activity of these same constructs, expressed as percent induction following 0–10 nM αMSH, relative to 0 nM αMSH. *p<.0001, Mc4r+Mrap2 vs. Mc4r at same [αMSH], by ANOVA. For most data points, error bars are obscured by symbols.

