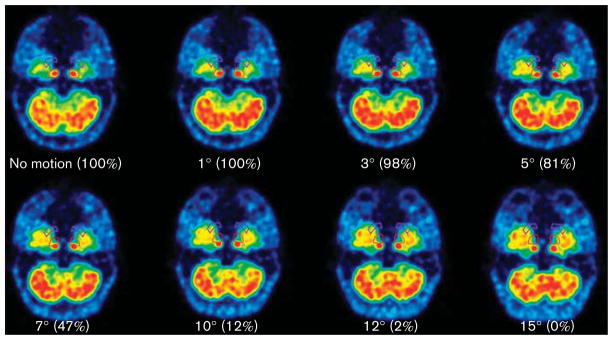
Fig. 1.

Transaxial views of the phantom at different rotation degrees. These are the summed early frames of the dynamic scan (the only ones in which carotids are clearly visible), rotated with the same amplitude as the last frames of each simulation. The round ROIs are for the carotids, and the comma-shaped ROIs are for the background activity. The numbers in parentheses represent the percentage of the phantom carotids inside the ROIs for each rotation degree. The carotids were completely outside the ROIs only for the maximum rotation. ROI, region of interest.
