
Fig. 2.
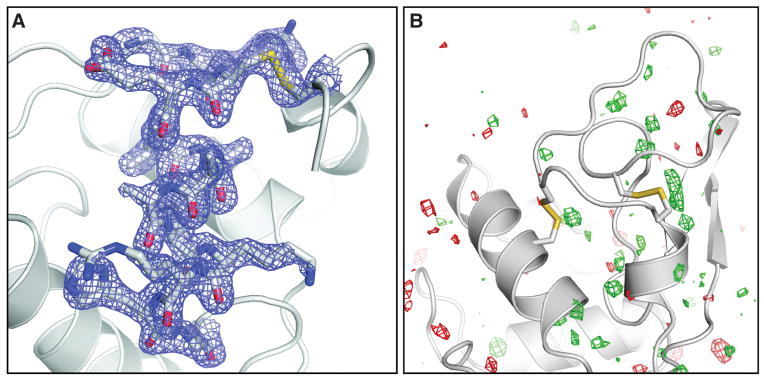
(A) Final, refined 2mFobs − DFcalc (1.5σ) electron density map (17) of lysozyme at 1.9 Å resolution calculated from 40-fs pulse data. (B) Fobs(40 fs) − Fobs (synchrotron) difference Fourier map, contoured at +3 σ (green) and −3 σ (red). No interpretable features are apparent. The synchrotron data set was collected with a radiation dose of 24 kGy.