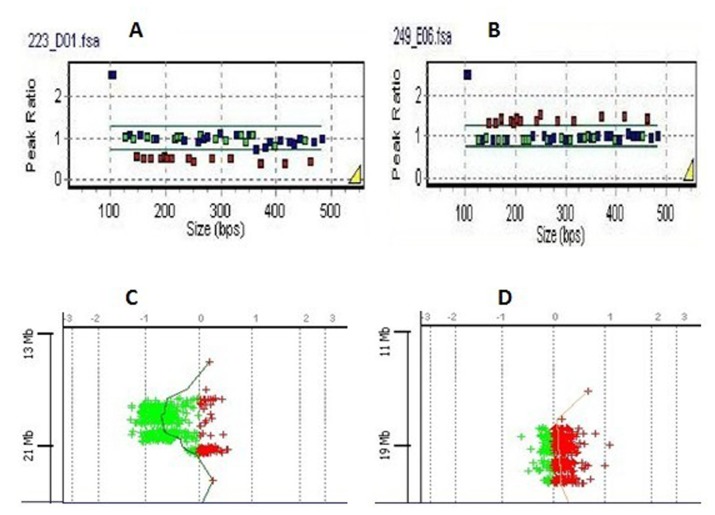
Figure 1. Dosage assessment of 22q11 by MLPA eletropherograms of two VCFS samples.
The MLPA data was presented in a ratio analysis format where the x axes represented fragment size in bp, and the y axes represented probe-height ratios. Squares indicated either deleted probes (height ratio <0.65) or duplicated probes (height ratio>1.35). Squares located between 0.65 and 1.35 on the y axis indicated non-deleted, non-duplicated probes. Two panels showed patients’ data as follow: A represent 3 Mb 22q11.2 deletion: B represent 3 Mb 22q11.2 duplication.
They were all confirmed by aCGH: gene views of 22q11 produced by the Agilent CGH Analytics software and showed the aberrant region, which was highlighted in color. The dots corresponded to the array targets, arranged on the y axes represented genomic position and on the x axes represented log2 intensity ratio value. C was the same case as A, D was the same case as B.

