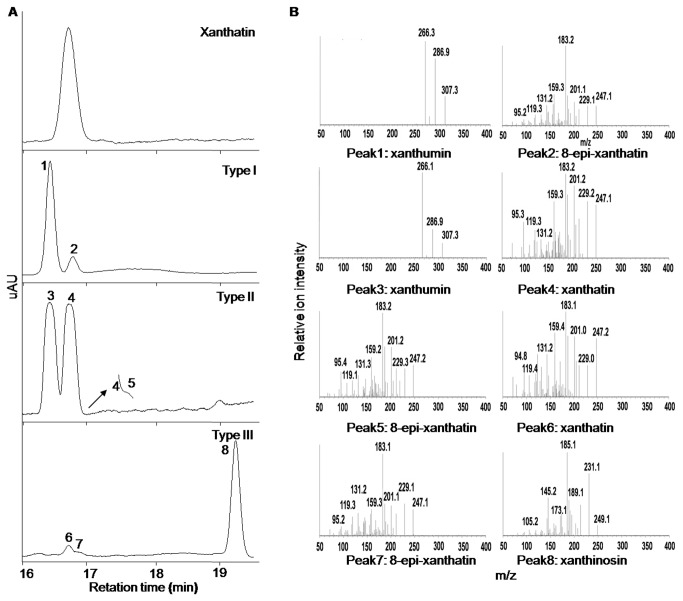
Figure 5. LC-MS analysis of the extracts from three chemotypes of X. strumarium glandular trichomes.
(A) The representative LC chromatograms at UV wavelength of 280 nm for xanthatin standard, and the glandular extracts from the Type I, Type II, and Type III cells; (B) the mass spectra of xanthatin standard, with each peak labelled. The collision energies used for xanthatin (standard), xanthatin (sample), 8-epi-xanthatin (sample), xanthumin (sample) and xanthinosin (sample) were 15 V, 15 V, 15 V, 13 V and 5 V respectively.

