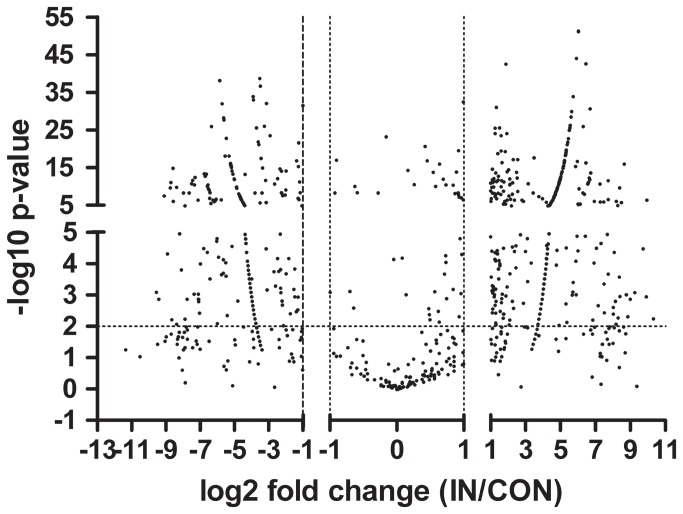
Figure 2. Global expression analysis of T. reesei sRNAs.
A volcano plot shows the magnitude (fold change; x-axis) and significance (P-value; y-axis) of the unique sRNAs between IN and CON samples. The horizontal dashed line indicates the threshold of statistical significance (P-value= 0.01). The vertical dashed line shows the fold changes of 2.0 (log2 = ±1.0). sRNAs were divided into three groups based on the fold changes (IN/CON) : (1) up-expressed sRNAs: log2 fold change≥1.0; (2) equally expressed sRNAs: -1.0<log2 fold change<1.0; (3) down-expressed sRNAs: log2 fold change ≤ -1.0.

