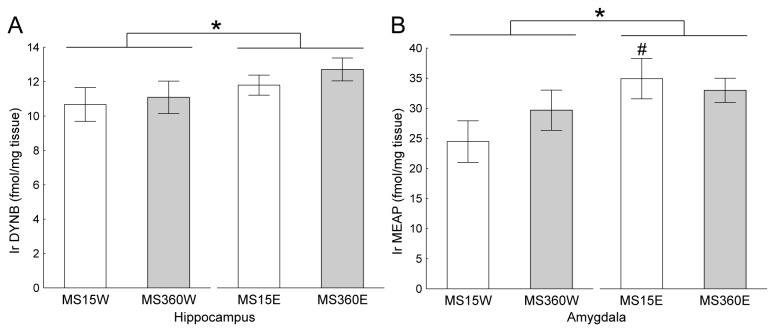
Figure 6. Alcohol-induced peptide levels in the hippocampus and amygdala.
The bars show the difference between water (W) and ethanol (E) groups of the maternal separation 15 min (MS 15) and maternal separation 360 min (MS 360) in mean ± SEM levels of a) dynorphin B (DYNB) in the hippocampus and b) Met-enkephalin-Arg6Phe7 (MEAP) in the amygdala. Ir = immunoreactive, * p < 0.05 overall effect of intake group, # p <0.05 compared to MS15W (factorial ANOVA followed by Fisher’s LSD test).

