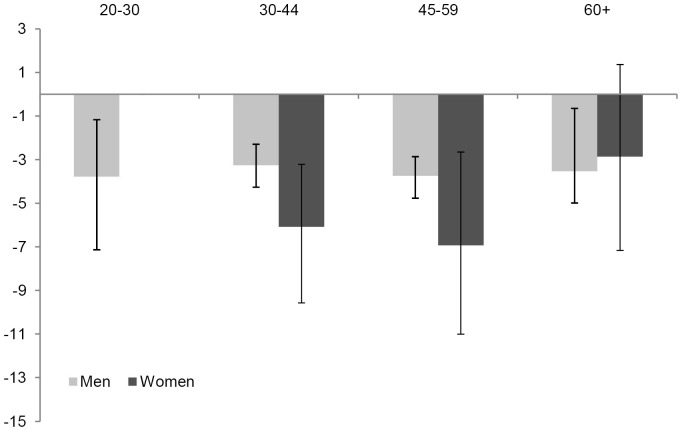
Figure 1. Contributions of age groups to differences in remaining life expectancies of homeless men and women as compared to the general Rotterdam population of men and women.
Difference in remaining life expectancy (homeless population – Rotterdam population) of men and women, at age 20 years§ decomposed by age group (in years). § For women the contribution below age 30 years is not presented because the number of deaths in homeless women was zero and the confidence intervals could not be obtained in the situation of zero deaths.

