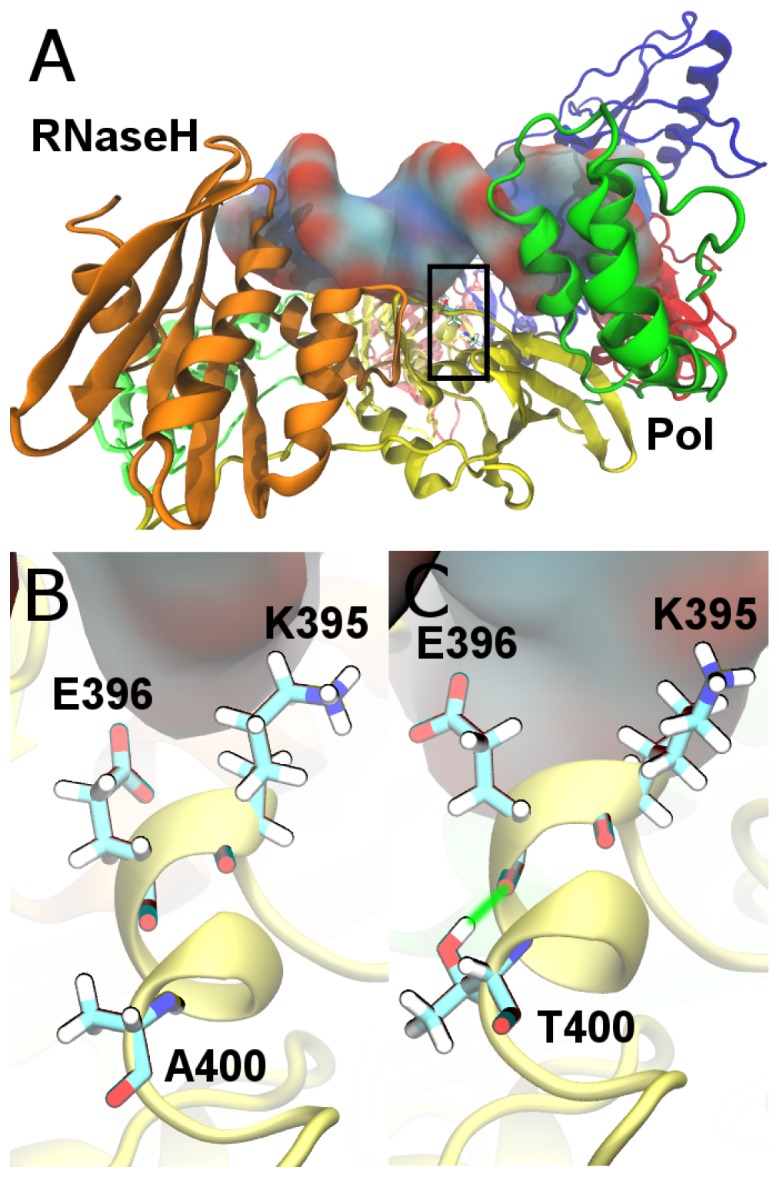
Figure 4. Structure of the HIV-1 reverse transcriptase (RT) enzyme.

(A) Shows RT bound to a DNA/DNA template/primer complex (shown in surface representation). The enzyme is shown in cartoon representation and coloured by subdomain; fingers are blue, palm red, thumb green, connection yellow and the RNaseH orange. The p66 subunit is shown in the foreground and in darker shades. A black rectangle indicates the location of the p51 RNaseH primer grip. (B) and (C) show detailed views of this region, including chemical representations of the residues K395 and E396 in the wild-type and A400T RT enzymes, respectively. A green line is used to illustrate the hydrogen bond formed between T400 and E396.
