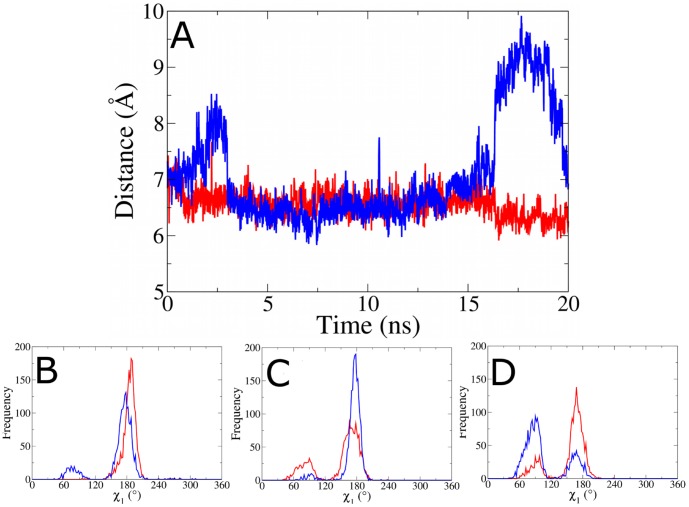
Figure 5. Distance between the scissile phosphate (−19) and the centre of mass of the RNaseH active site (p66 residues 443, 478, 498 and 549) over the course of the simulations of the HIV-1 RT bound to an RNA/DNA substrate.
The simulation for the wild-type A400 is shown in red, and for substitution T400 in blue. Frequency distributions of the χ1 dihedral of p51 residue E396 in simulations of (B) RNA/DNA hybrid substrate, (C) double stranded DNA substrate and (D) NVP bound HIV-1 RT (results for the unbound RT are shown in Fig S16 in File S1). The simulation for A400 is shown in red, T400 in blue.

