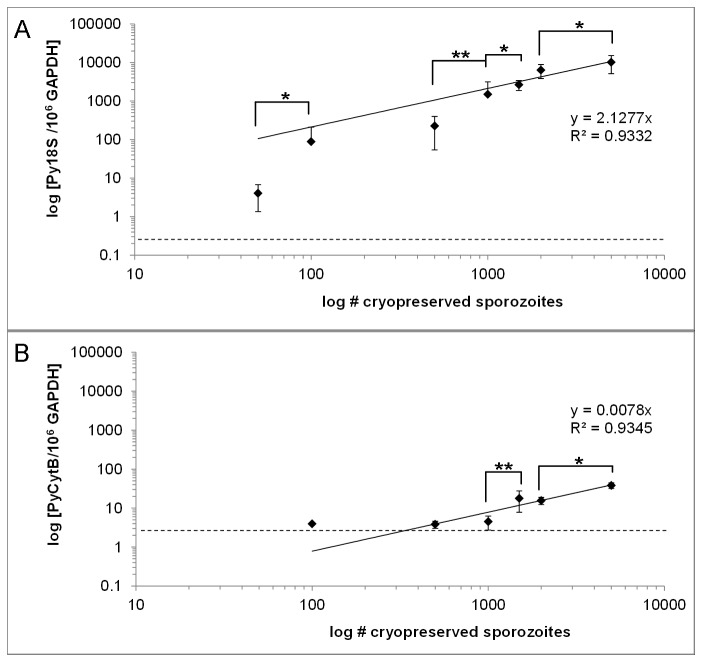
Figure 2. Limit of Detection after infection with different numbers of cryopreserved sporozoites.
Detection of (A) Py18S rRNA or (B) PyCytB mRNA in liver RNA extracts of BALB/c mice 40h after infection with 50, 100, 500, 1000, 1500, 2000 or 5000 cryopreserved sporozoites. Data are represented as mean ‘plasmid equivalent’ for each group (n=3-7 mice/group). Two technical replicates of each mouse sample were run twice in independent qRT-PCR experiments and the mean ‘plasmid equivalent’ measured for each mouse/group was calculated. The error bars represent the mean variation between mice receiving the same sporozoite dose, calculated as the standard error for each group. A linear trendline was fitted to the data points to represent the correlation of measured values to the number of injected sporozoites. The dotted line represents the limit of detection defined as the mean value of target cDNA per 106 copies GAPDH within the group of samples for which a maximum of 5% of reactions failed. Statistical significance between groups of mice receiving different sporozoite doses was evaluated using One-way ANOVA followed by two-tailed Mann-Whitney test, * p<0.05, ** p<0.005.

