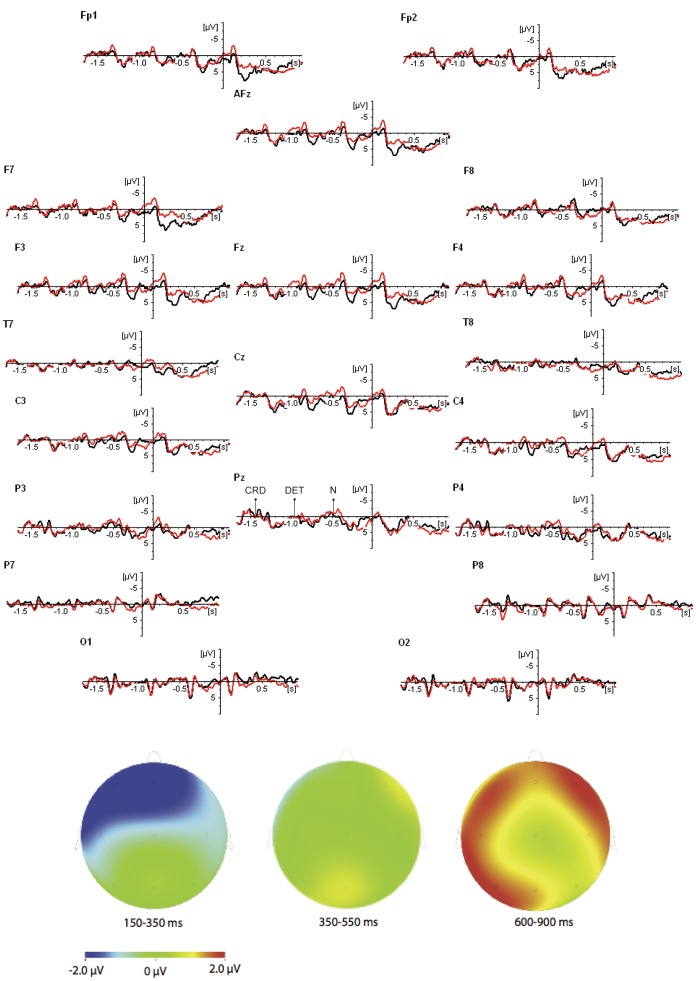
Figure 1. ERP waveforms for the two conditions in Experiment 1:
Neutral (black line) and Violation (red line); topographic maps represent Violation minus Neutral; there is an extended pre-stimulus time-window in which the onset of the coordinator (CRD), determiner (DET), and noun (N) is indicated by arrows.

