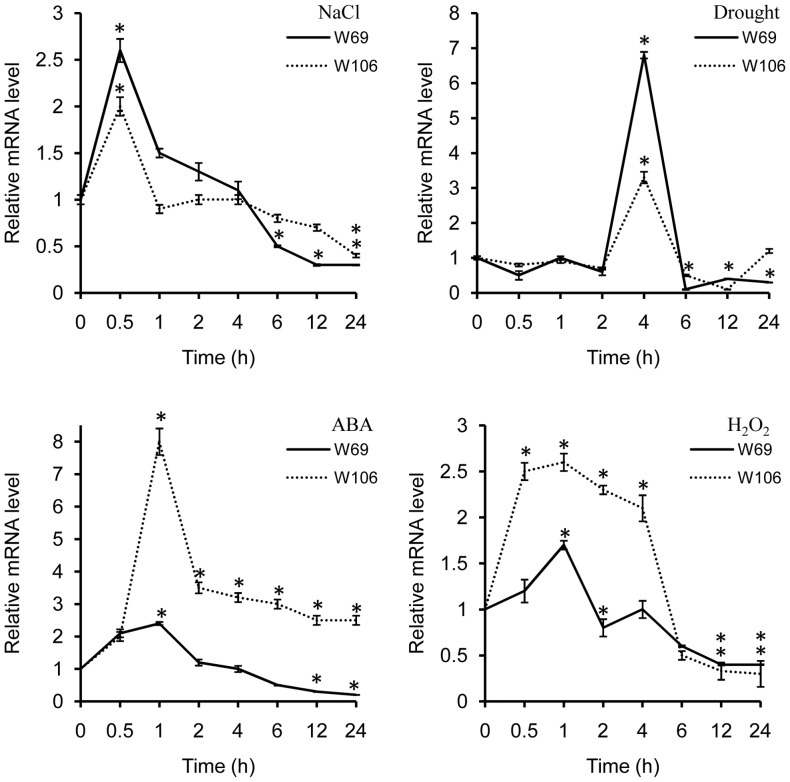
Figure 3. Expression patterns of W69 and W106 under various stress conditions, including salinity (A), drought (B), H2O2 (C), and ABA (D).
Total RNA was isolated from leaves of wheat seedlings. The actin gene was used as an internal reference. Relative expression of W69 and W106 were normalized to the transcript abundances in untreated controls (normalized as 1). Error bars represent standard deviation (SD) among three biological replicates. Asterisks indicate a significant difference (*P<0.05; Student's t-test) relative to untreated control (at 0 hours).

