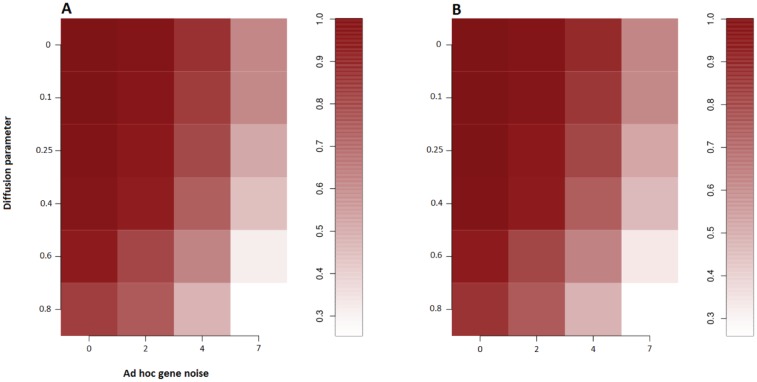
Figure 3. Robustness to expression noise.
(A) Sensitivity and (B) precision of the method in predicting the gene-expression-driving miRNAs when varying the level of gene-interactions noise (via the diffusion parameter  ) and the intensity of the noise in the differential gene expression level (via the variable
  ). All predicted miRNAs have the correct influence signs.

