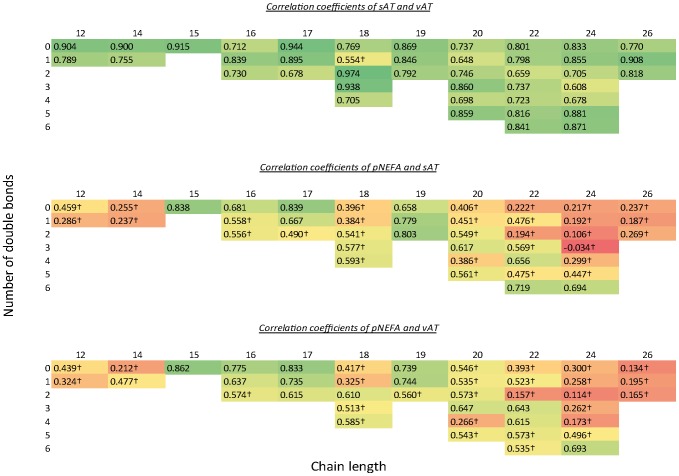
Figure 2. Correlation of pNEFA and AT sites.
Correlation coefficients (r) of plasma nonesterified fatty acids (pNEFA), subcutaneous adipose tissue (sAT) and visceral adipose tissue (vAT). FA are arranged by chain length and double bond number. Colour gradient with red (r = 0), yellow (r = 0.5) and green (r = 1). † p>0.001068.

