
Figure 2. Tissue distribution of GNRs after single I.V. administration to male and female normal animals.
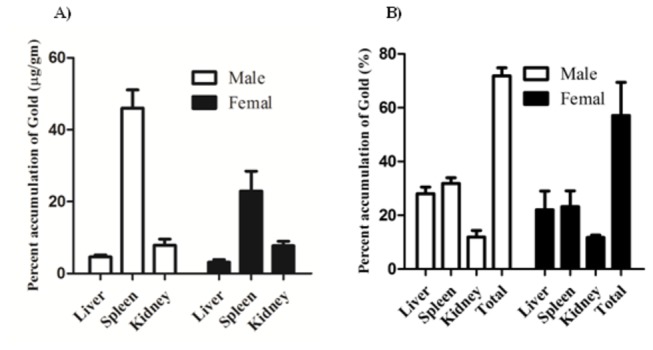
GNRs were administered by I.V. injection (0.1 mg/kg) and assayed after two weeks in major excretory organs (liver, spleen and kidney). Concentration of GNRs (A) and the percent residual amount of the total administered dose (B) are presented. Data are presented as mean ± SEM (n=6).