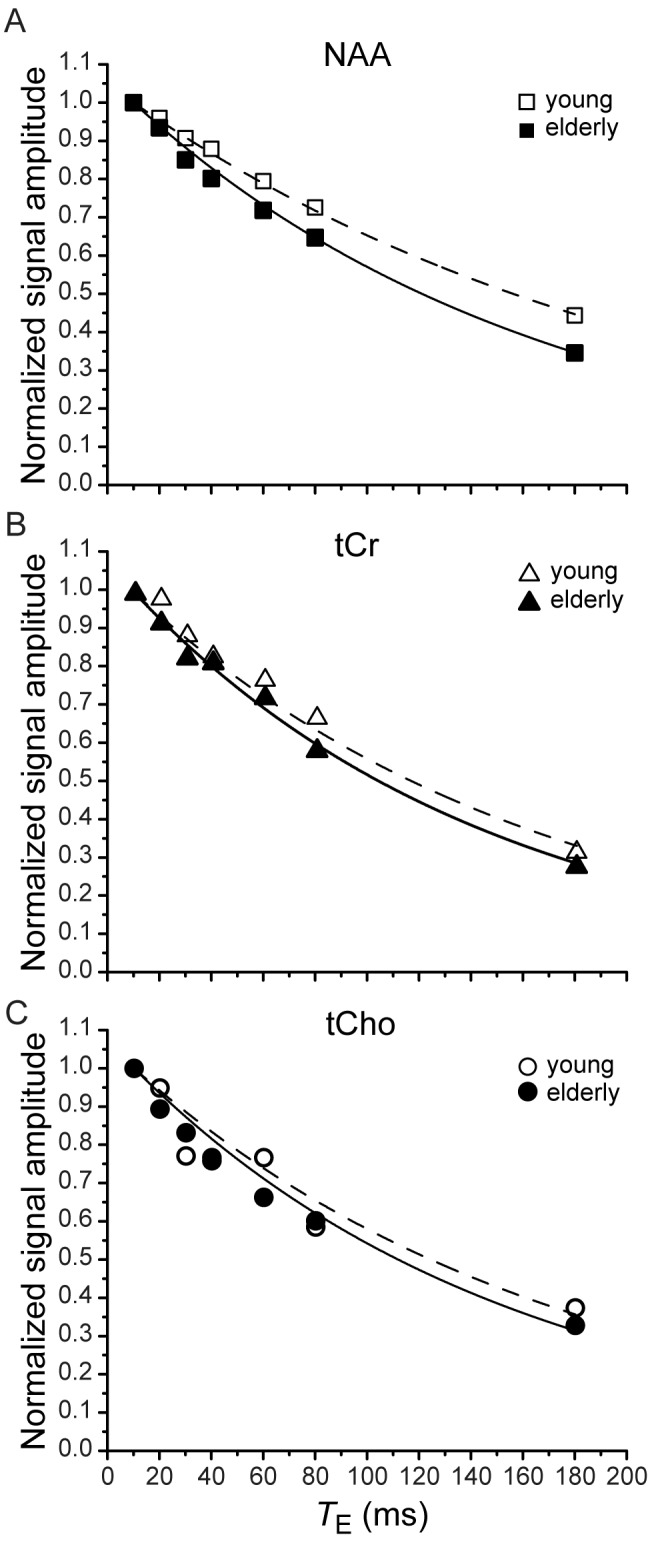
Figure 2. T 2 fits for metabolites in young and elderly subjects.

Individual exponential fits (represented by decaying lines) of the experimentally measured data for (A) the NAA singlet at 2.01 ppm, (B) the tCr signal at 3.03 ppm, and (C) the tCho singlet at 3.2 ppm in one representative young and one representative elderly subject. The amplitude of all data sets was normalized by setting the first T E point to unity for both young and elderly subjects. For all metabolites and all subjects, T 2s were fit with R2 ≥ 0.918, with the lowest R2 for tCho.
