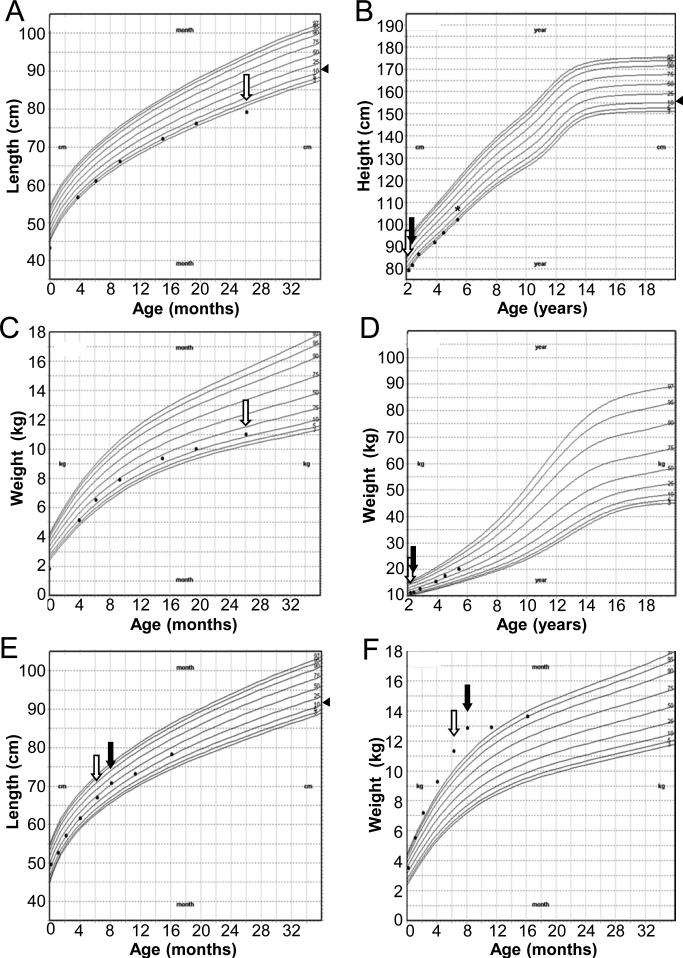
Figure 1.
Growth curves (CDC) for Case 1 (A-D) and Case 2 (E, F). Measurements for Case 1 are uncorrected for gestational age. Arrowheads (◀) to the right of height or length curves indicate midparental height (B) or midparental height percentile (A,E). Open arrows indicate diagnosis of central hypothyroidism. Closed arrows indicate normalization of serum free T4. Asterisk (*) indicates diagnosis of growth hormone deficiency.

