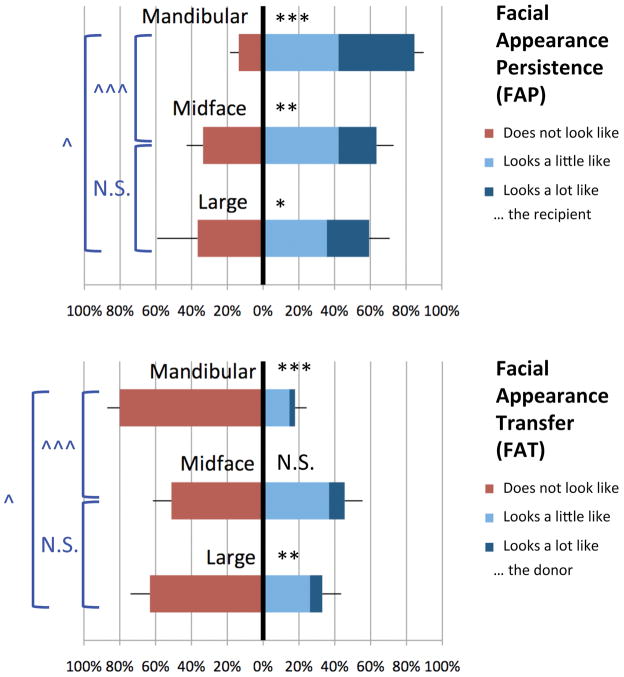
Figure 3. Rates of FAP [upper graph] and FAT [lower graph] for three VFT patterns.
The proportion of reviewer responses to the Recipient Question [upper graph] and Donor Question [lower graph] for three facial transplant patterns (Mandibular, Midface, Large) are displayed. The asterisks represent the p-values from a one-sample chi-squared test of the “Looks like”/”Does not look like” ratio against a null hypothesis of a 50%/50% split. The wedges (^) represent the p-values from the pair-wise test for equal FAP or FAT between patterns. */^ = p < 0.05; **/^^ = p < 0.01; ***/^^^ = p < 0.001; N.S. = not significant at α = 0.05. The Mandibular pattern has significantly higher rates of FAP than the Midface or Large patterns [upper graph] and significantly lower rates of FAT than the Midface or Large patterns [lower graph].

