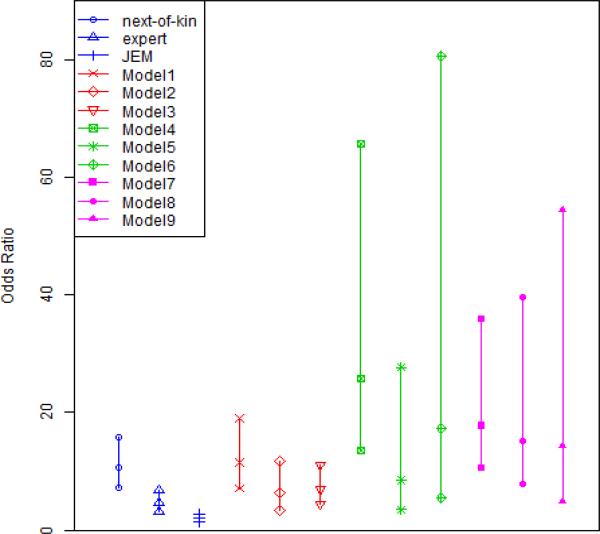
Figure 3.
ORs and 95% Credible Intervals. Model1-Model9 refer to the 9 models in Table 3 (Each vertical line presents the posterior median with 95% credible intervals). Blues lines represent individual measurements; Red lines represent independent models (cej = 0); Green lines represent dependent models in the special case (ceij = cei where ei = 1, 0); purple lines represent dependent models in the general case (c01 ≠ c02 ≠ c03 ≠ c11 ≠ c12 ≠ c13).

