
Figure 2. The presence of an APOBEC mutation pattern in exome datasets of different cancer types.
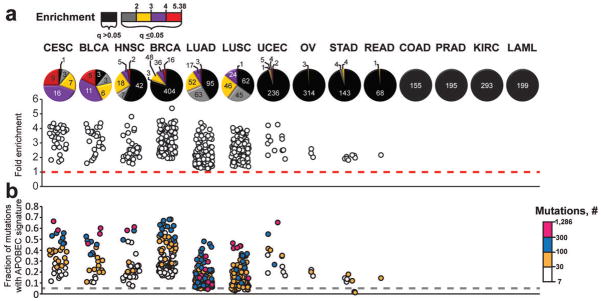
Cancer types are abbreviated as in TCGA: Cervical squamous cell carcinoma and endocervical adenocarcinoma (CESC), Bladder Urothelial Carcinoma (BLCA), Head and Neck squamous cell carcinoma (HNSC), Breast invasive carcinoma (BRCA), Lung adenocarcinoma (LUAD), Lung squamous cell carcinoma (LUSC), Uterine Corpus Endometrioid Carcinoma (UCEC), Ovarian serous cystadenocarcinoma (OV), Stomach adenocarcinoma (STAD), Rectum adenocarcinoma (READ), Colon adenocarcinoma (COAD), Prostate adenocarcinoma (PRAD), Kidney renal clear cell carcinoma (KIRC), and Acute Myeloid Leukemia (LAML). The fold enrichment (a) and mutation load (b) of the APOBEC mutation pattern was determined within each of 2,680 whole exome sequenced tumors, representing 14 cancer types. Samples were categorized by the statistical significance of the APOBEC mutation pattern (calculated by one-sided Fisher’s Exact Test comparing the ratio of the number of C→T or →G substitutions and complementary G→A or →C substitutions that occur in and out of the APOBEC target motif (tCw/wGa) to an analogous ratio for all cytosines or guanines that reside inside and outside of the tCw/wGa motif within a sample fraction of the genome; Benjamini-Hochberg corrected q-value < 0.05) and the magnitude of enrichment. The number of tumor samples in each category is presented on each pie graph in (a). Samples displaying q-values > 0.05 are represented in black. These samples are excluded from the scatter graphs in (a) and (b) that depict the range of enrichments and fractional mutation load, respectively. Color scales indicate the magnitude of enrichment (a) and the number of APOBEC signature mutations (b) for samples with q<0.05. Dashed lines indicate effects expected for random mutagenesis.