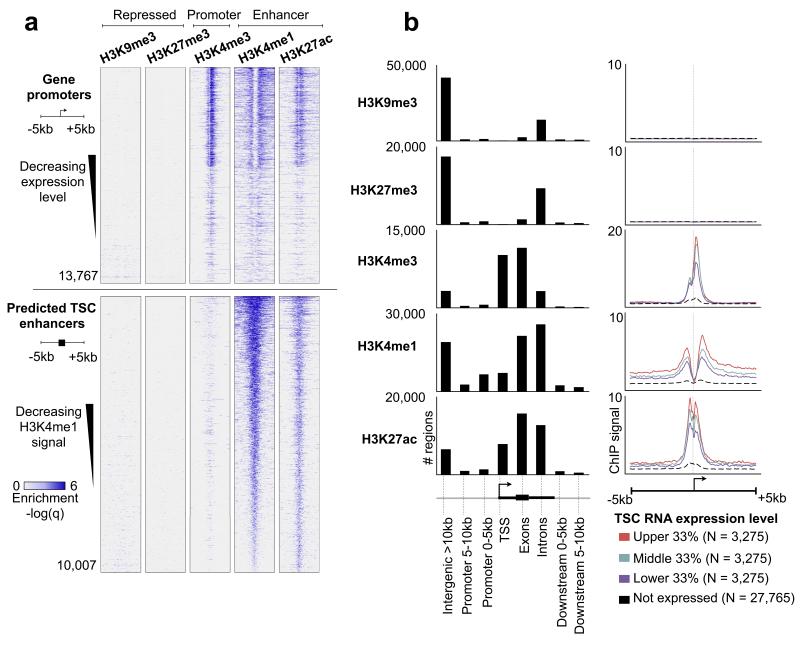
Figure 1. The epigenetic landscape of mouse TSCs using histone ChIP-Seq.
(a) Top five panels: heatmap representation of histone ChIP-Seq enrichment across gene promoters. Each row represents a 10 kb window centered at the gene TSS and extending 5 kb upstream and 5 kb downstream (see cartoon left side). Genes are sorted by decreasing expression levels. Lower five panels are the same histone marks, centered around predicted enhancers (defined as regions co-enriched for H3K27ac + H3K4me1 and located >5 kb away from a gene TSS), and sorted by decreasing average H3K4me1 enrichment across the window. (b) Left panel: distribution of histone marks within genomic elements, including gene TSS, exons, introns, promoters (0-5 or 5-10 kb away from TSS), and intergenic regions (>10 kb away from TSS). The Y axis represents the total number of marks present in each category. Right panel: averaged ChIP-Seq enrichment profile across a 10 kb window centered on the gene TSS. Genes are grouped into 4 categories: high expression (red), medium expression (green), low expression (blue), and nondetectable expression (black dashed). The Y axis represents the average ChIP-Seq enrichment (q value).

