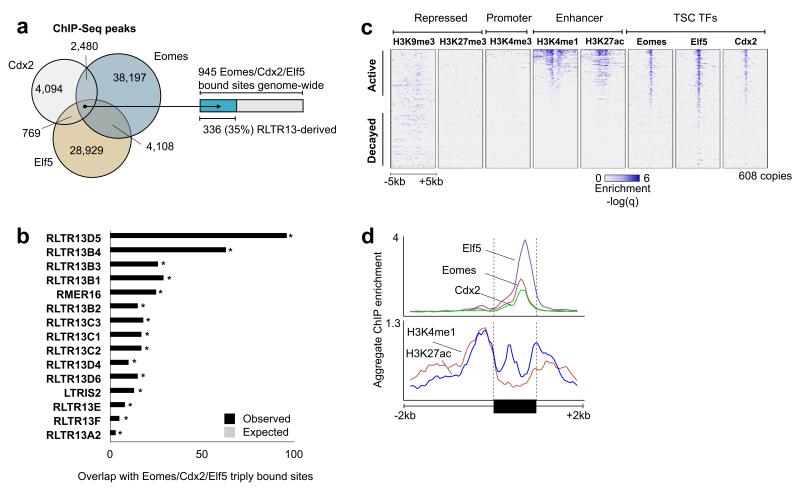
Figure 4. Core TSC transcription factors bind RLTR13D5 copies.
(a) Venn diagram representing the genomic overlap between Eomes, Cdx2, and Elf5 ChIP-Seq binding sites. (b) Barplot showing TEs overrepresented within the 945 genomic regions triply bound by Eomes, Cdx2, and Elf5. The top 15 results are shown, where black bars represent the observed overlap and gray represents the random expectation (< 1 in all cases). All TEs displayed are significantly overrepresented (Bonferroni P < 4.1 × 10⁻¹⁸, binomial test). (c) Heatmap representation of all 608 RLTR13D5 copies. Rows represent 10kb windows centered on an individual copy, and the ChIP enrichment signal from each experiment is displayed in each column. Elements are sorted by decreasing average H3K4me1 signal across the 10 kb window. (d) Aggregate ChIP enrichment profiles for transcription factors (top panel) and histones (bottom) across all RLTR13D5 copies, including 2 kb flanking genomic regions. LTR: Long terminal repeat. ERV: endogenous retrovirus.

