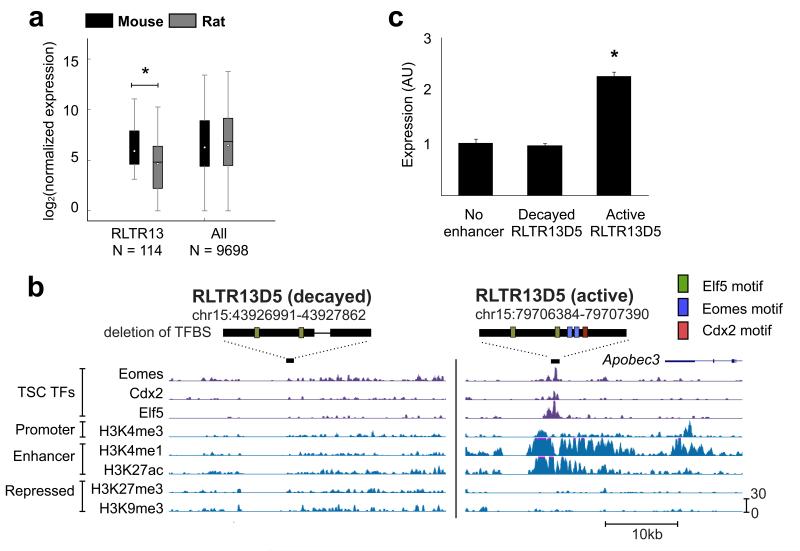
Figure 5. RLTR13D5 functions to drive trophoblast expression.
(a) Boxplot depicting normalized 3′ RNA-Seq levels for both mouse and rat. Whiskers extend to 1.5 times the inner quartile range. For genes neighboring Eomes/Elf5/Cdx2 triply bound RLTR13 elements within 100 kb, mouse expression levels are higher than in rat (P = 0.0036, Wilcoxon signed rank test). (b) UCSC genome screenshots of the “decayed” and “active” RLTR13D5 copies used in the luciferase assay. Above each screenshot, the element is represented by a black rectangle with predicted binding sites as in Fig. 4a. The decayed copy harbors a deletion represented by the thin black line. (c) Luciferase assay demonstrating reporter activity driven by “active” versus “decayed” RLTR13D5 copies (P = 3.5 × 10⁻⁷, T test). Relative luciferase activity is expressed as the means ± S.D.

