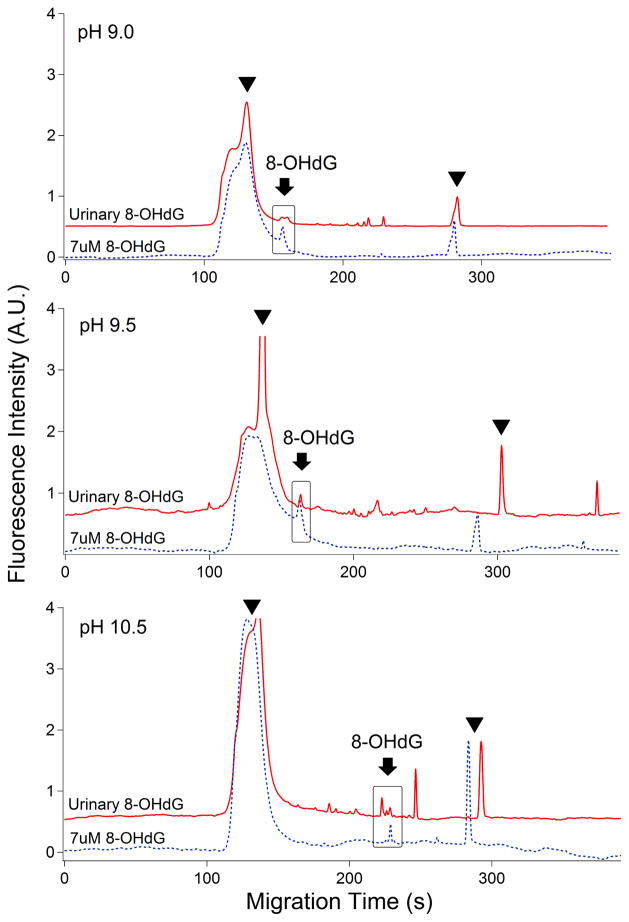
Figure 5.
Electropherograms of the separation efficiency of 8-OHdG standard and urinary 8-OHdG complexes with 20 mM sodium tetraborate buffer at pH 9.0 (top panel); pH 9.5 (middle panel); and pH 10.5 (bottom panel). Arrowhead: secondary antibody; Arrow: 8-OHdG. All the experimental conditions are the same as in Figure 2. Top trace is offset in the y-axis for the clarity.

