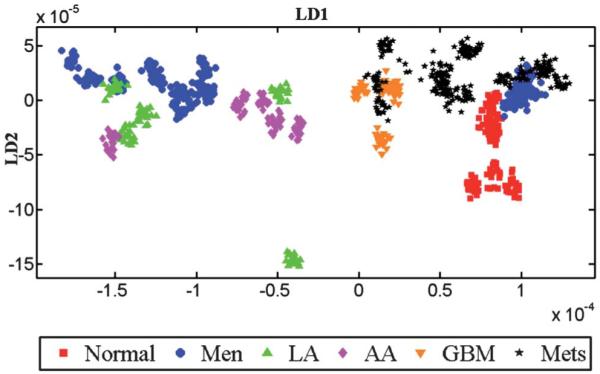
Fig. 5.

LDA scores plot of IR spectra showing the inter-class variance. To obtain this scores plot, each patient in the dataset is treated as a class without specifying the histological classes (i.e., normal or tumour). After LDA, individual patients’ spectra are given a matching colour and symbol in accordance with their original tissue types. Thus, any observed clustering of patients would be spontaneous suggesting a common underlying biochemical signature.
