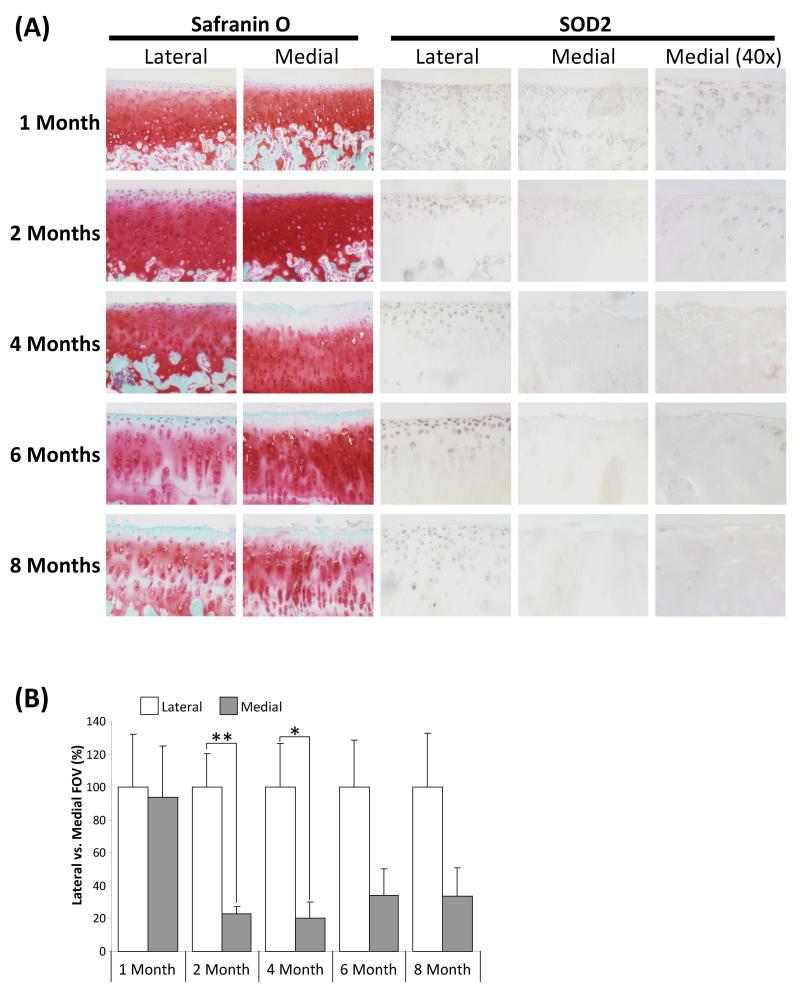
Figure 3.
Immunohistochemical analysis of SOD2 expression in representative specimens of Dunkin-Hartley guinea pig articular cartilage. A, Cartilage sections are representative of 5 animals at each time point (1 to 12 months of age). Sections were either stained with safranin ‘O’ as a marker of proteoglycan or subjected to immunohistochemistry using the labelled anti-SOD2 or normal rabbit IgG (negative control – data not shown). Lateral and medial tibial plateaus are as indicated. Images shown are at × 10 magnification, unless indicated otherwise. B, Immunohistochemical images of lateral and medial tibial plateaus, of fixed exposure, from 5 animals were quantified using the ImageJ software. For each image the percentage staining in each field of view (FOV) was calculated. For each age group the staining in the lateral plateau is arbitrarily 100% + SEM. P values were calculated using Student’s t-test, where * represents P<0.05 and ** P<0.01.

