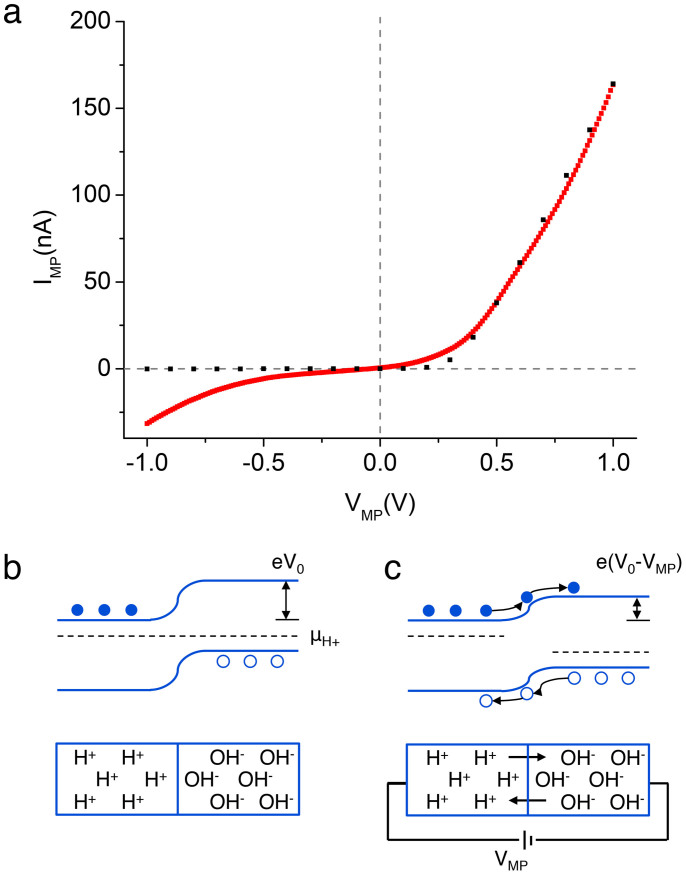
Figure 3. H+- OH− junction.
(a) Red trace- Experimental data for IV characteristics of a H+ OH− junction formed by maleic chitosan and proline chitosan. The curve shows the expected nonlinearity. Black dots - data from simulations for the same junction using the semiconductor model. (b) When a H+ doped and OH− doped material are placed into contact OH− diffuse into the H+ region and H+ diffuse into the OH− region until the μH+ on both sides is the same. H+ and OH− recombine in the depletion region. A contact potential V0 occurs across the junction and is dependent of the difference in μH+ of both sides. (c) A forward bias (+ive on H+ side) applied between source and drain reduces the contact barrier e(V0-VMP) and thermionic emission of H+ into OH− side and vice versa occurs.

