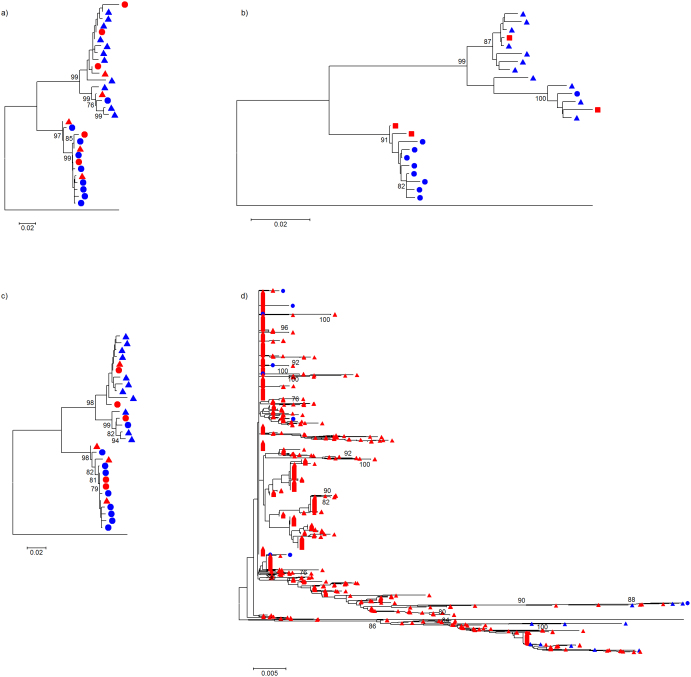
Figure 3. Evolutionary history inferred by neighbor-joining, using an optimized nucleotide substitution model, that compares HIV-1 variants reconstructed by each quasispecies assembler with the original Sanger clones; trees are rooted using the mapping reference sequence.
Panels (a), (b), (c), and (d) show Geneious™ de novo, PredictHaplo, QuRe and ShoRAH, respectively. Node numbers represent% bootstrap replicates (of 500) ≥ 75%. Bullets represent variants at a frequency ≥ 5%, and triangles those < 5% (not available for PredictHaplo, shown by squares). Blue color indicates Sanger isolates, and red reconstructed variants.

