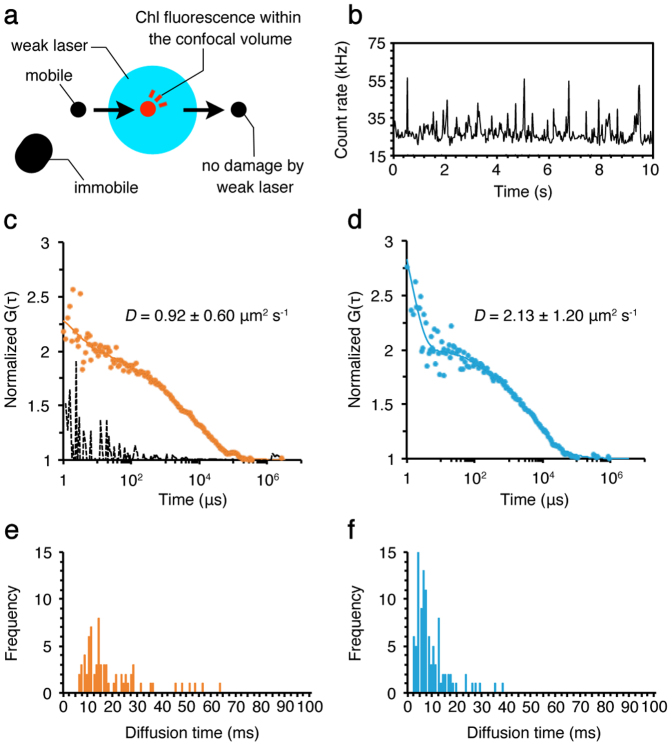
Figure 2. FCS measurements of the CBPs in the stroma lamellae isolated from wild type.
(a) The top view diagram of FCS measurements using the isolated membrane. A mobile protein (a black circle) moves into the confocal detection volume (a blue circle), where the protein (a red circle) emits fluorescence. The fluorescence signal is not detected after the protein moves out of the confocal volume. The weak laser does not cause damage to the protein moving quickly through the confocal volume. The large, immobile protein (a black oblong) in the membrane does not emit fluorescence because it does not move into the confocal volume, and thus no photobleaching occurs. (b) A typical stationary time-course of Chl fluorescence fluctuations observed by using the isolated stroma lamellae. The FAFs (dots) obtained from Chl fluorescence fluctuations were used to calculate the diffusion coefficients (D) of the CBPs in the membrane in state 1 (c) and state 2 (d) by curve fitting with a one- or two-component model with triplet term (lines) (see equation 2 in Methods). The broken line in (c) was measured as a negative control for the random signals observed outside of the analyzed membranes, which indicated no correlation, confirming that we did not measure protein diffusion leaked from membranes. The decay faster than 2 μs in FAFs is caused by the afterpulsing of detector58, which has no effect on the diffusion coefficients we observed here. The diffusion time of the CBPs in the membrane in state 1 (e) and state 2 (f) was also measured by FCS. Distribution of mobile CBPs with certain diffusion time is shown. The calculation was done by using the 30 sets of data obtained during the total of 5 min measurements in each membrane.

