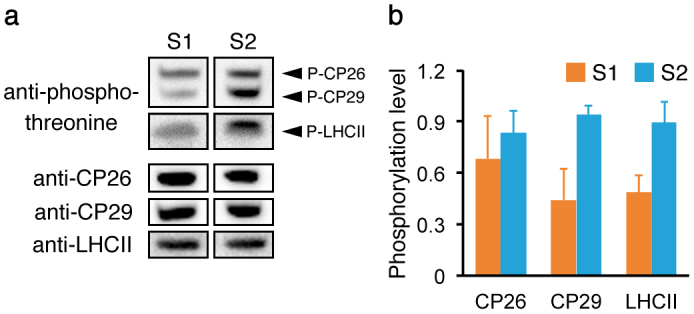
Figure 3. Quantified LHCII phosphorylation levels in the stroma lamellae.

LHCII isolated from the stroma lamellae in state 1 (S1) and state 2 (S2) was used. (a) The representative result of the immunoblotting using an anti-phosphothreonine antibody was shown. Proteins were normalized to the protein amount of LHCII. The protein amount of CP26 and CP29 was also determined by immunoblotting. Each band for S1 and S2 was derived from the same samples on the same experiment. The blots for each protein were cropped for clarity. The full length run of the blot is shown in Fig. S3. (b) The phosphorylation levels of CP26, CP29, and LHCII determined by immunoblotting were quantified using ImageJ software. Values are means of five independent experiments (±SD) and normalized to the highest value obtained in each immunoblotting.
