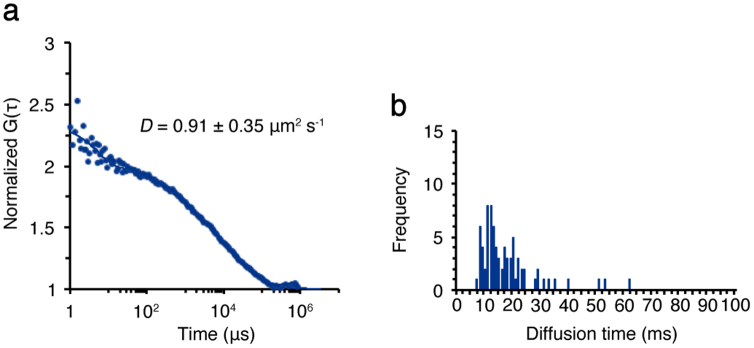
Figure 4. FCS measurements of the CBPs in the stroma lamellae isolated from the stt7 mutant.

FCS measurements were similarly done as in Fig. 2. (a) The FAFs (dots) obtained from Chl fluorescence fluctuations were used to calculate the diffusion coefficients (D) of the CBPs in the membrane isolated from the stt7 mutant. (b) The diffusion time of the CBPs in the membrane of the stt7 mutant was measured by FCS.
