Figure 4.
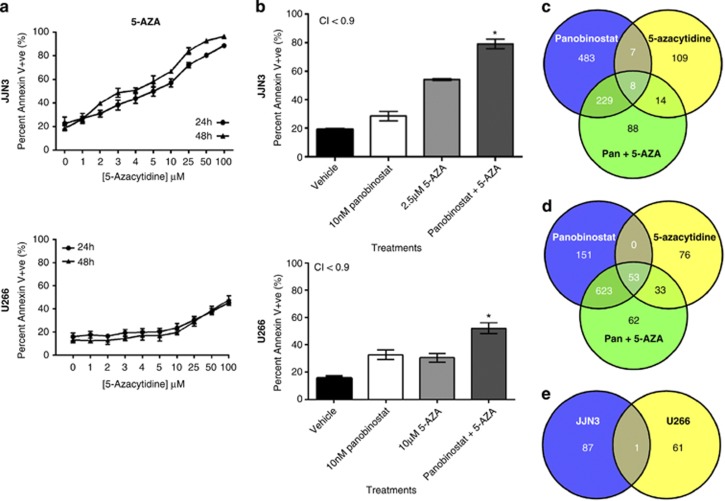
(a) Human MM cell lines display differential and dose-dependent sensitivities to 5-AZA. Single-agent dose–response curves were constructed in human MM cell lines (JJN3 and U266) treated with 5-AZA for 24 and 48 h. (b) Synergistic induction of apoptosis in JJN3 and U266 cells with panobinostat was combined with 5-AZA after 48 h (CI<0.9) *P<0.05 verses single agents: (c) JJN3 cells or (d) U266 cells were treated with panobinostat, 5-AZA or the combination of both agents at synergistic concentrations (described in Figure 4b) and assessed for changes in gene expression using next-generation RNA sequencing after 24 h. Gene set enrichment was assessed using CAMERA.40 Each Venn diagram depicts the number of MSigDB gene sets enriched within each treatment and within each cell line (two-sided P<0.05, n=3); (e) demonstrates the number of distinct or overlapping MSigDB gene sets enriched when JJN3 or U266 cells were treated with the combination of panobinostat with 5-AZA

