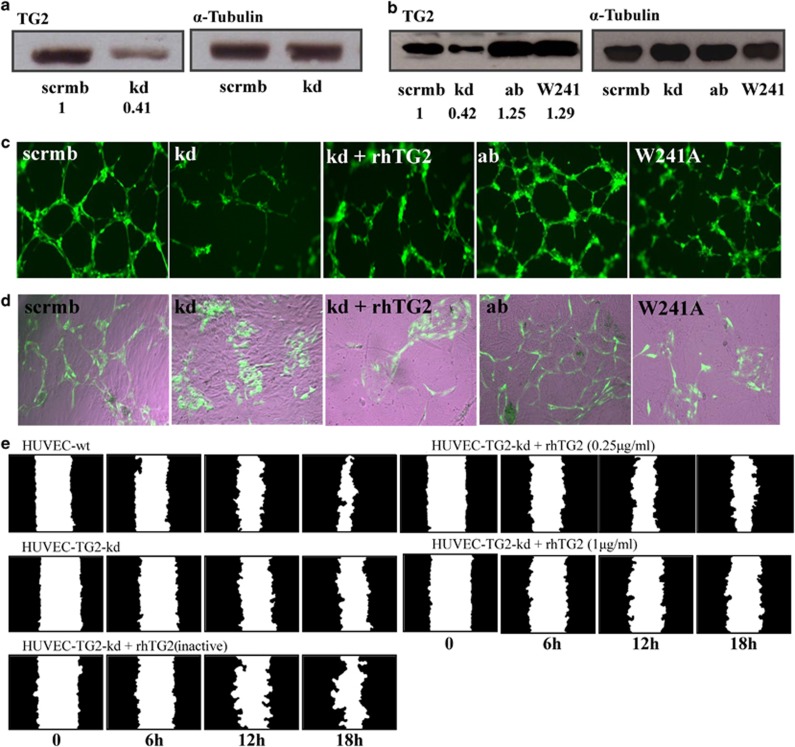
Figure 4.
Manipulating TG2 expression in HUVECs affects tubule formation and cell migration. (a) Western blot analysis of TG2 expression levels in lysates of HUVEC-TG2wt and HUVEC-TG2kd (HUVECs transduced with TG2 scrambled or targeted shRNA) and (b) TG2 add back, either the active wt enzyme or the W241A mutant in the kd HUVECs. α-Tubulin was used as a loading control and ratio of band intensity for TG2 is shown below taken from three separate experiments. (c and d) Tubule formation of HUVECs expressing wt TG2, TG2kd or the TG2 mutants after reintroduction into the TG2kd cells. HUVEC-TG2wt, -TG2kd, -TG2ab, -TG2kd/W241A or TG2kd in the presence of exogenously added rhTG2 (0.25 μg/ml), induced to form tubule structures on Matrigel in complete EGM-2 medium as described in the Materials and Methods, for 6 h at 37 °C in 5% CO2. Cells (GFP, green) were photographed using an epifluorescent microscope as described in the Materials and Methods. (d) HUVECs as described in (c) (GFP, green), co-cultured with human dermal fibroblast as feeder cells in the enriched EGM medium for 12 days as described in the Materials and Methods. Images were taken as in (c). The tubule like structures shown were analysed by the TCS Cellworks AngioSys Image Analysis Software (ZHA-1800) (Supplementary Table S3), as described in the Materials and Methods using a bright-field microscope. (e) Scratch assay for migration of HUVEC-TG2wts and HUVEC-TG2kd on FN, in the absence or presence of exogenously added rhTG2 at different concentrations, analysed as in Figure 3

