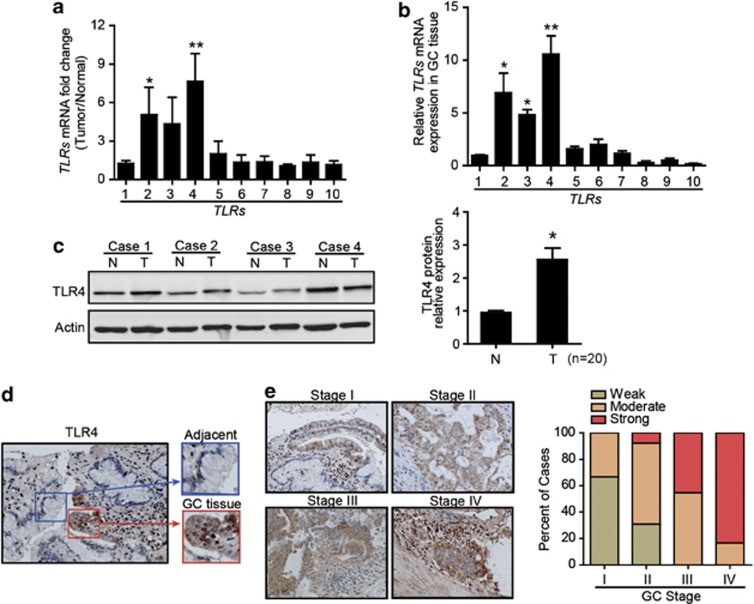
Figure 1.
The elevated expression of TLR4 in GC tissues. (a) The ratios of mRNA levels for a panel of TLRs in GC tissues versus axillary normal gastric tissues were shown (n=10) (*P<0.05; **P<0.01, compared with TLR1). (b) Relative expression of TLRs (TLR1-10) mRNA in GC tissues were shown (n=10) (*P<0.05; **P<0.01). (c) Western blot was performed for TLR4 protein expression in fresh surgical GC specimens (T) and matched adjacent normal tissues (N). The statistical plots are representative of 20 independent cases (*P<0.05). (d) Immunohistochemical sections showed TLR4-staining patterns in normal gastric mucosa cells and GC cells (left image, × 200; right image, × 400). (e) Representative IHC sections of TLR4 expression in different clinical TNM stages were shown ( × 100). Histogram showed the percentage of weak, moderate and strong TLR4 staining cases in each clinical stage

