Figure 5.
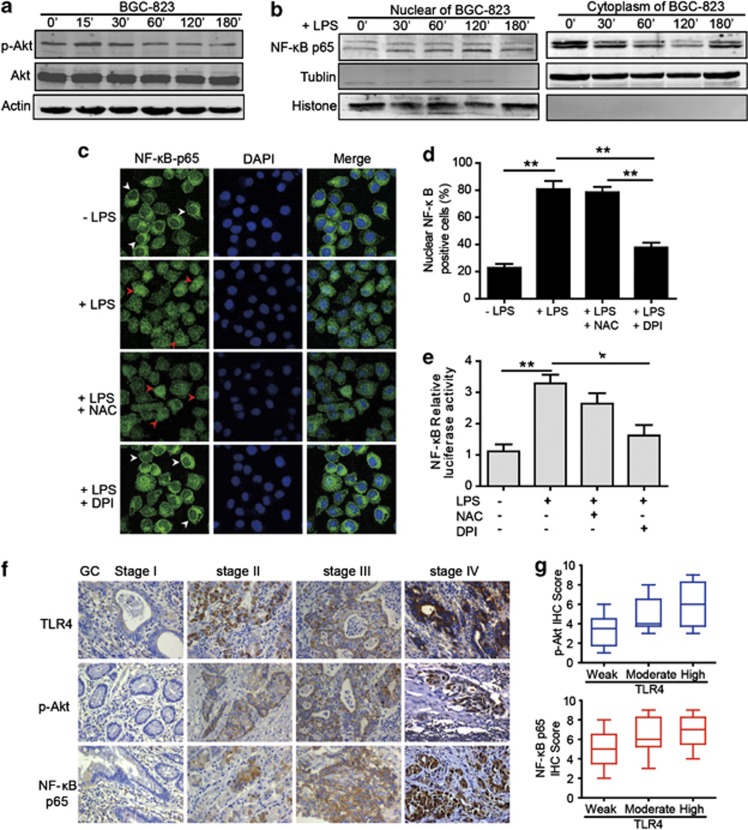
ROS production is required for LPS-induced NF-κB activation. (a) Successive changes in Akt phosphorylation at different times after LPS treatment were shown in BGC-823 cell by western blot. (b) BGC-823 cell was stimulated with LPS for the indicated time, and then immunoblot for NF-κB p65 was performed on the cytoplasmic and nuclear extracts. (c) Immunofluorescence assay of BGC-823 cell treated with LPS, NAC or DPI indicated the localization of NF-κB p65 (green fluorescence, arrowheads). DAPI (blue) was used as a nuclear counter stain. White arrowheads showed that NF-κB p65 mainly localized in the cytoplasm and red arrowheads indicated the nuclear translocation of NF-κB p65. The original magnification was × 1000. (d) Graph showed the quantification of nuclear NF-κB p65-positive staining. Results are presented as means±S.E.M.s (**P<0.01). (e) Graph showed the relative nuclear NF-κB-p65 promoter activity by the dual-luciferase assay. Data are presented as means±S.E.M.s (*P<0.05; **P<0.01). (f) Representative IHC staining patterns of TLR4, p-Akt and NF-κB p65 in GC tissues with different TNM stages were shown. The original magnification was × 400. (g) The box and whisker plots showed that IHC scores of p-Akt and NF-κB p65 were associated with various TLR4 expression intensity (weak, n=6; moderate, n=6; and high, n=6)

