
Figure 5.
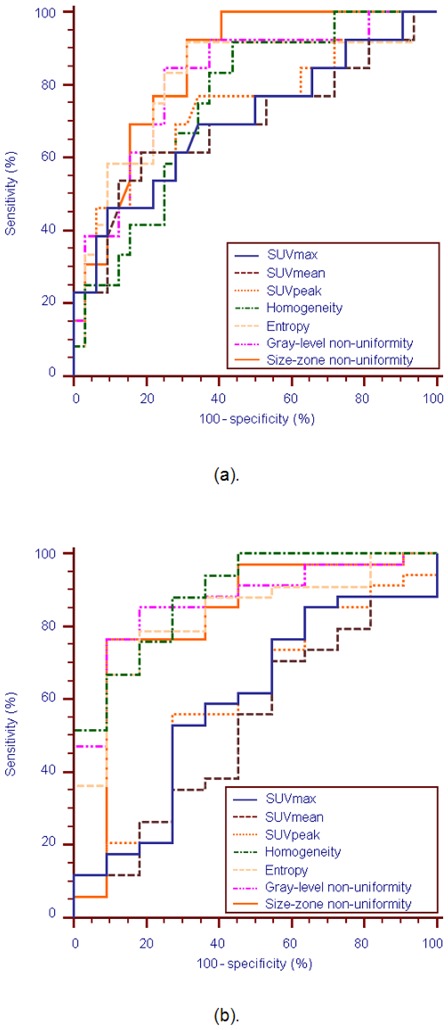
ROC curves for the SUVmax, SUVmean, SUVpeak, local homogeneity, uniform tumor areas intensity variability and size-zone variability, for identification of (a). CR patients, and (b). responders (PR or CR)
Official websites use .gov
A
.gov website belongs to an official
government organization in the United States.
Secure .gov websites use HTTPS
A lock (
) or https:// means you've safely
connected to the .gov website. Share sensitive
information only on official, secure websites.
ROC curves for the SUVmax, SUVmean, SUVpeak, local homogeneity, uniform tumor areas intensity variability and size-zone variability, for identification of (a). CR patients, and (b). responders (PR or CR)