
Figure 13.
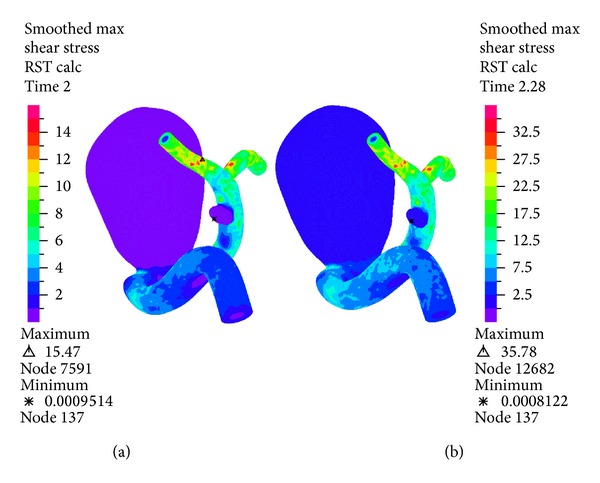
Simulation 12. Distribution of wall shear stress during diastole on the left and systole on the right.
Official websites use .gov
A
.gov website belongs to an official
government organization in the United States.
Secure .gov websites use HTTPS
A lock (
) or https:// means you've safely
connected to the .gov website. Share sensitive
information only on official, secure websites.
Simulation 12. Distribution of wall shear stress during diastole on the left and systole on the right.