
Figure 4.
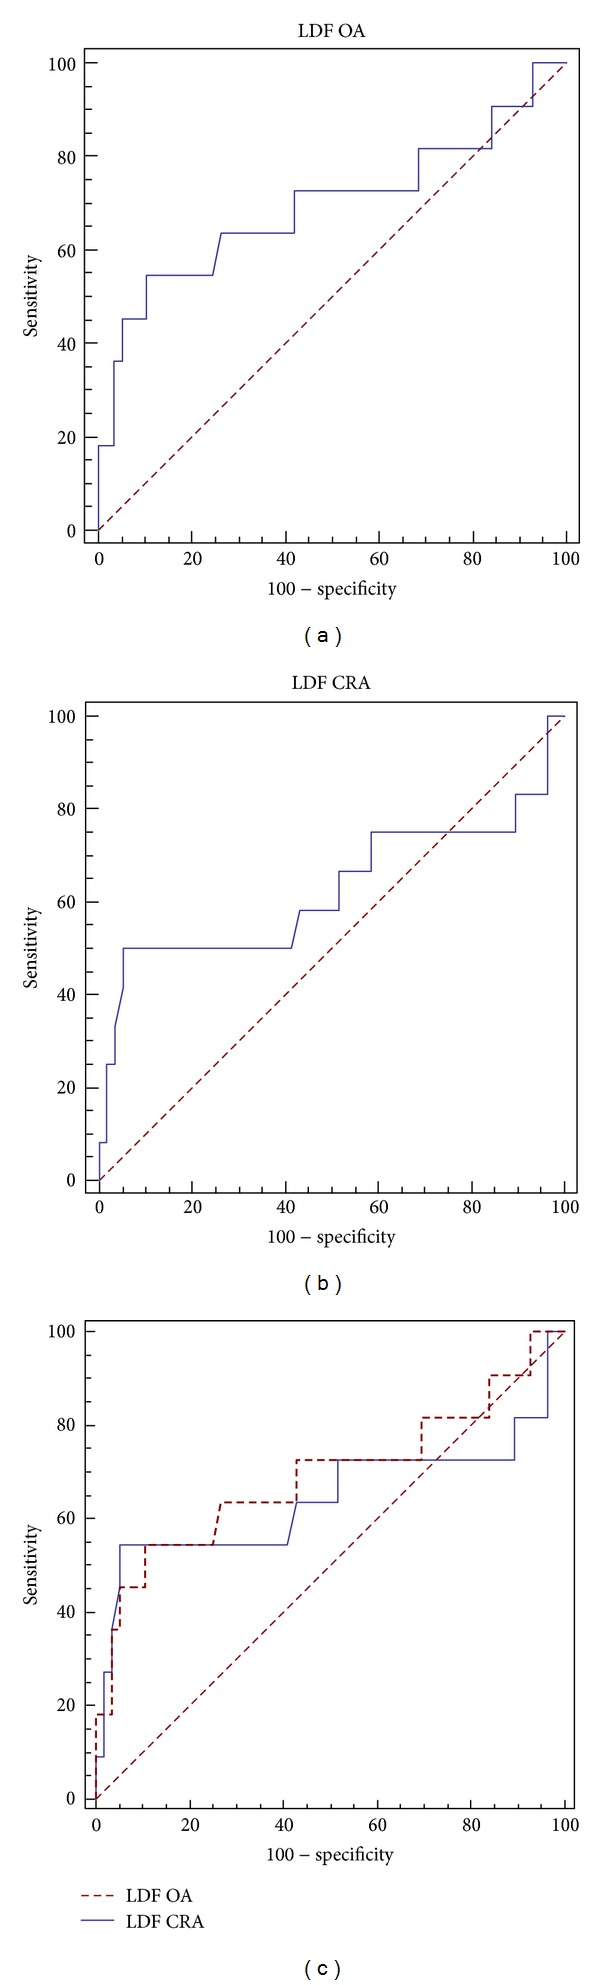
The ROC curve shows the diagnostic capability of the LFD for ophthalmic artery (a) and central retinal artery (b). The comparison between both ROC curves (c) shows best calculated cutoff points.
Official websites use .gov
A
.gov website belongs to an official
government organization in the United States.
Secure .gov websites use HTTPS
A lock (
) or https:// means you've safely
connected to the .gov website. Share sensitive
information only on official, secure websites.
The ROC curve shows the diagnostic capability of the LFD for ophthalmic artery (a) and central retinal artery (b). The comparison between both ROC curves (c) shows best calculated cutoff points.