
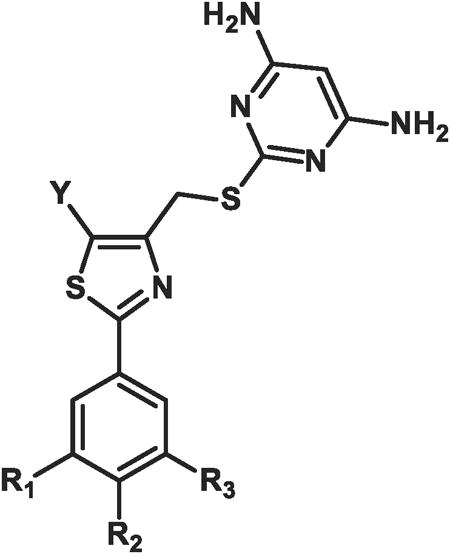
Table 2. In vitro biological data in l1210 and cem cells for compounds 15-18a.
| |||||||||
|---|---|---|---|---|---|---|---|---|---|
|
| |||||||||
| Compound | R1 | R2 | R3 | IC50 (μM) L1210 cells | IC50 (μM) CEM cells | ||||
|
|
|||||||||
| a Y = Me | b Y = Et | c Y = Pr | a Y = Me | b Y = Et | c Y = Pr | ||||
| 15 | H | OCH3 | OCH2CH2F | 0.035 (± 0.015) | 0.030 (± 0.077) | 0.003 (± 0.000) | 0.018 (± 0.012) | 0.007 (± 0.002) | 0.003 (± 0.000) |
| 16 | F | H | F | 0.595 (± 0.163) | 0.620 (± 0.170) | 0.385 (± 0.262) | 0.150 (± 0.099) | 0.162 (± 0.019) | 0.173 (± 0.157) |
| 17 | H | F | H | 0.395 (± 0.134) | 0.265 (± 0.163) | 0.170 (± 0.099) | 0.230 (± 0.134) | 0.083 (± 0.043) | 0.037 (± 0.020) |
| 18 | H | H | F | 0.255 (± 0.021) | 0.510 (± 0.014) | 0.175 (± 0.007) | 0.092 (± 0.048) | 0.011 (± 0.038) | 0.031 (± 0.024) |
a
lnhibitory activity measured by 3H-deoxycytidine (3H-dC) uptake in murine L1210 and in CCRF-CEM human cells. Values reported are the mean ± SD of at least n = 2 independent experiments.