Figure 3.

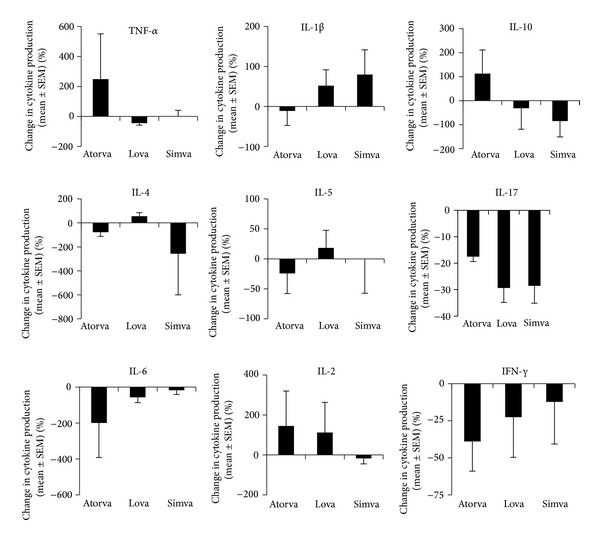
Graphs showing percentage changes in cytokine production by cells cultured with PMA/ionomycin ± statins. These studies show a multitude of varied responses indicating that the different statins have slightly different profiles of action.

Graphs showing percentage changes in cytokine production by cells cultured with PMA/ionomycin ± statins. These studies show a multitude of varied responses indicating that the different statins have slightly different profiles of action.