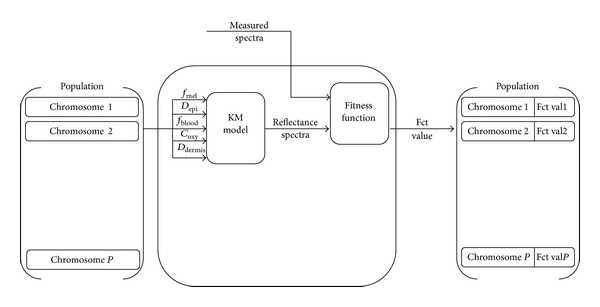
Figure 6.

GA fitness function GA. Each chromosome of the population is used to simulate a reflectance spectrum. The simulated reflectance spectrum is compared with the measured one. The fitness function outputs a value corresponding based on the similarity between the two spectra. The fitness value is then used to classify the population.
