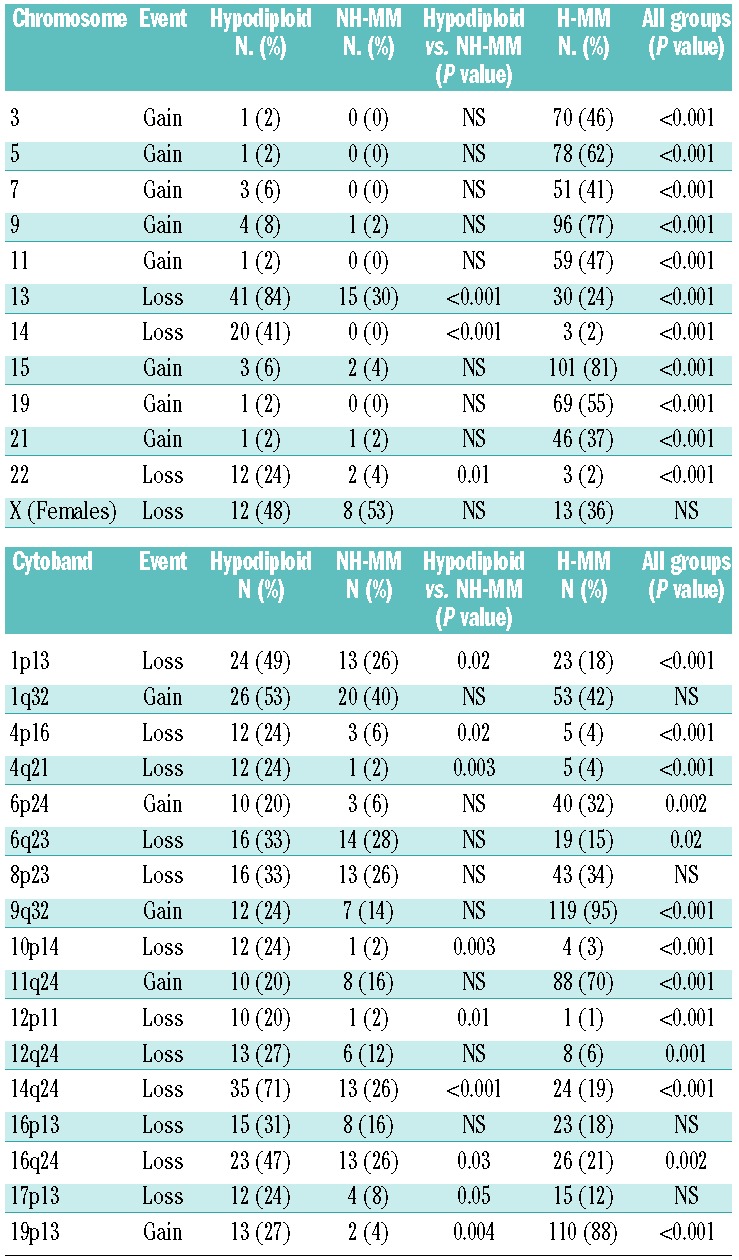
Table 1.
Copy number abnormalities of whole chromosomes and the most frequent minimal region cytobands affected in the hypodiploid group were compared between NH-MM and H-MM groups. A 20% cutoff was used to identify those considered abnormal in hypodiploid cases. “NS” (not significant).

