
Figure 2.
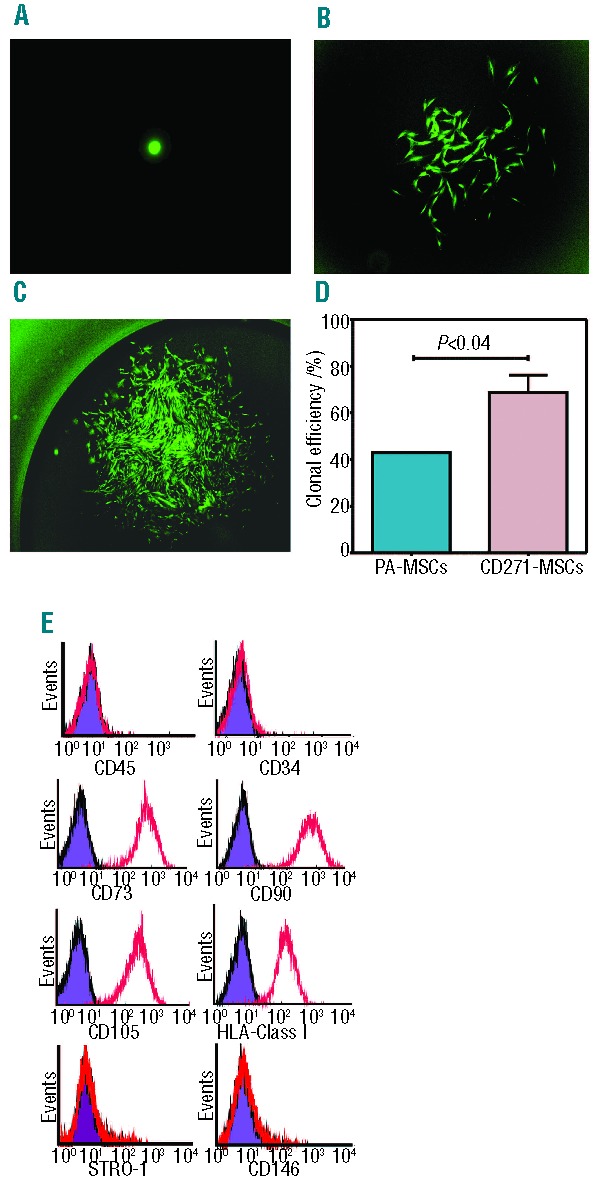
Clonogenic potential of single sorted MSCs and their phenotype. (A) On Day 1 post-sorting each well was monitored for GFP-positive cells under a fluorescence microscope, and wells containing more than one cell were excluded from the study (magnification: 100x). (B) Developing colony-forming unit-fibroblast (CFU-F) on Day 7 (magnification: 40x). (C) Confluent CFU-F colony at Day 21. These CFU-Fs were detached, expanded and then used to assess their proliferative, differentiation and allosuppressive potential (magnification 20x). (D) Clonogenic potential of single-sorted CD271-MSCs and PA-MSCs. Data are presented as a mean±SEM of single-sorted CD271-MSCs or PA-MSCs that were able to give rise to CFU-Fs. (E) Clonally-derived CD271-MSCs were negative for CD45 and CD34, while expressed typical MSC antigens (colored histograms represent isotype control, whereas red lines represent percentage of MSCs expressing the antigens).